In my previous tutorial, I taught you how to create and use a tone chart in Photoshop. However things are different in Lightroom and we can’t really create the same tone chart. Using the tone curve and color adjustments is quite difficult in Lightroom. So to make things easier, I created for you this chart for Lightroom. You can place your own photo in the chart to use as a reference and then the settings you use here can be saved as a preset and applied to your other photos. But this chart goes a bit further than the tone chart I introduced in my previous video. And instead of just letting you use the tone curve easier, it also has a color chart that makes color adjustments easier as well. This technique is very useful whether you want to color grade a single photo with good control or if you want to create an entire pack of Lightroom presets to share with others. So if you’re interested, keep reading and I’ll show you how it works.
Prelimiary Check
Before we begin the tutorial, look at this gradient. This gradient you see right now should appear to be grayscale on your monitor.

If you notice any color banding like the image below, it means that there might be something wrong with your monitor’s color calibration. If you see any color banding, try recalibrating your monitor or just temporarily disabling your monitor’s profile for now. When learning to use the tone curve, it’s important that this chart looks accurate on your monitor – grayscale with no color banding.
Lightroom Color Grading Chart Tutorial
Step 1
Okay so hopefully everything is fine. Let’s start the tutorial. You’ll first need to download a chart I made and you can find the download link in the video description. There’s two charts you can use; one is for Lightroom and the other is for Photoshop. For this video, I’ll be showing you how to use the chart in Lightroom. I’ll get to the Photoshop chart in another video.

Step 2
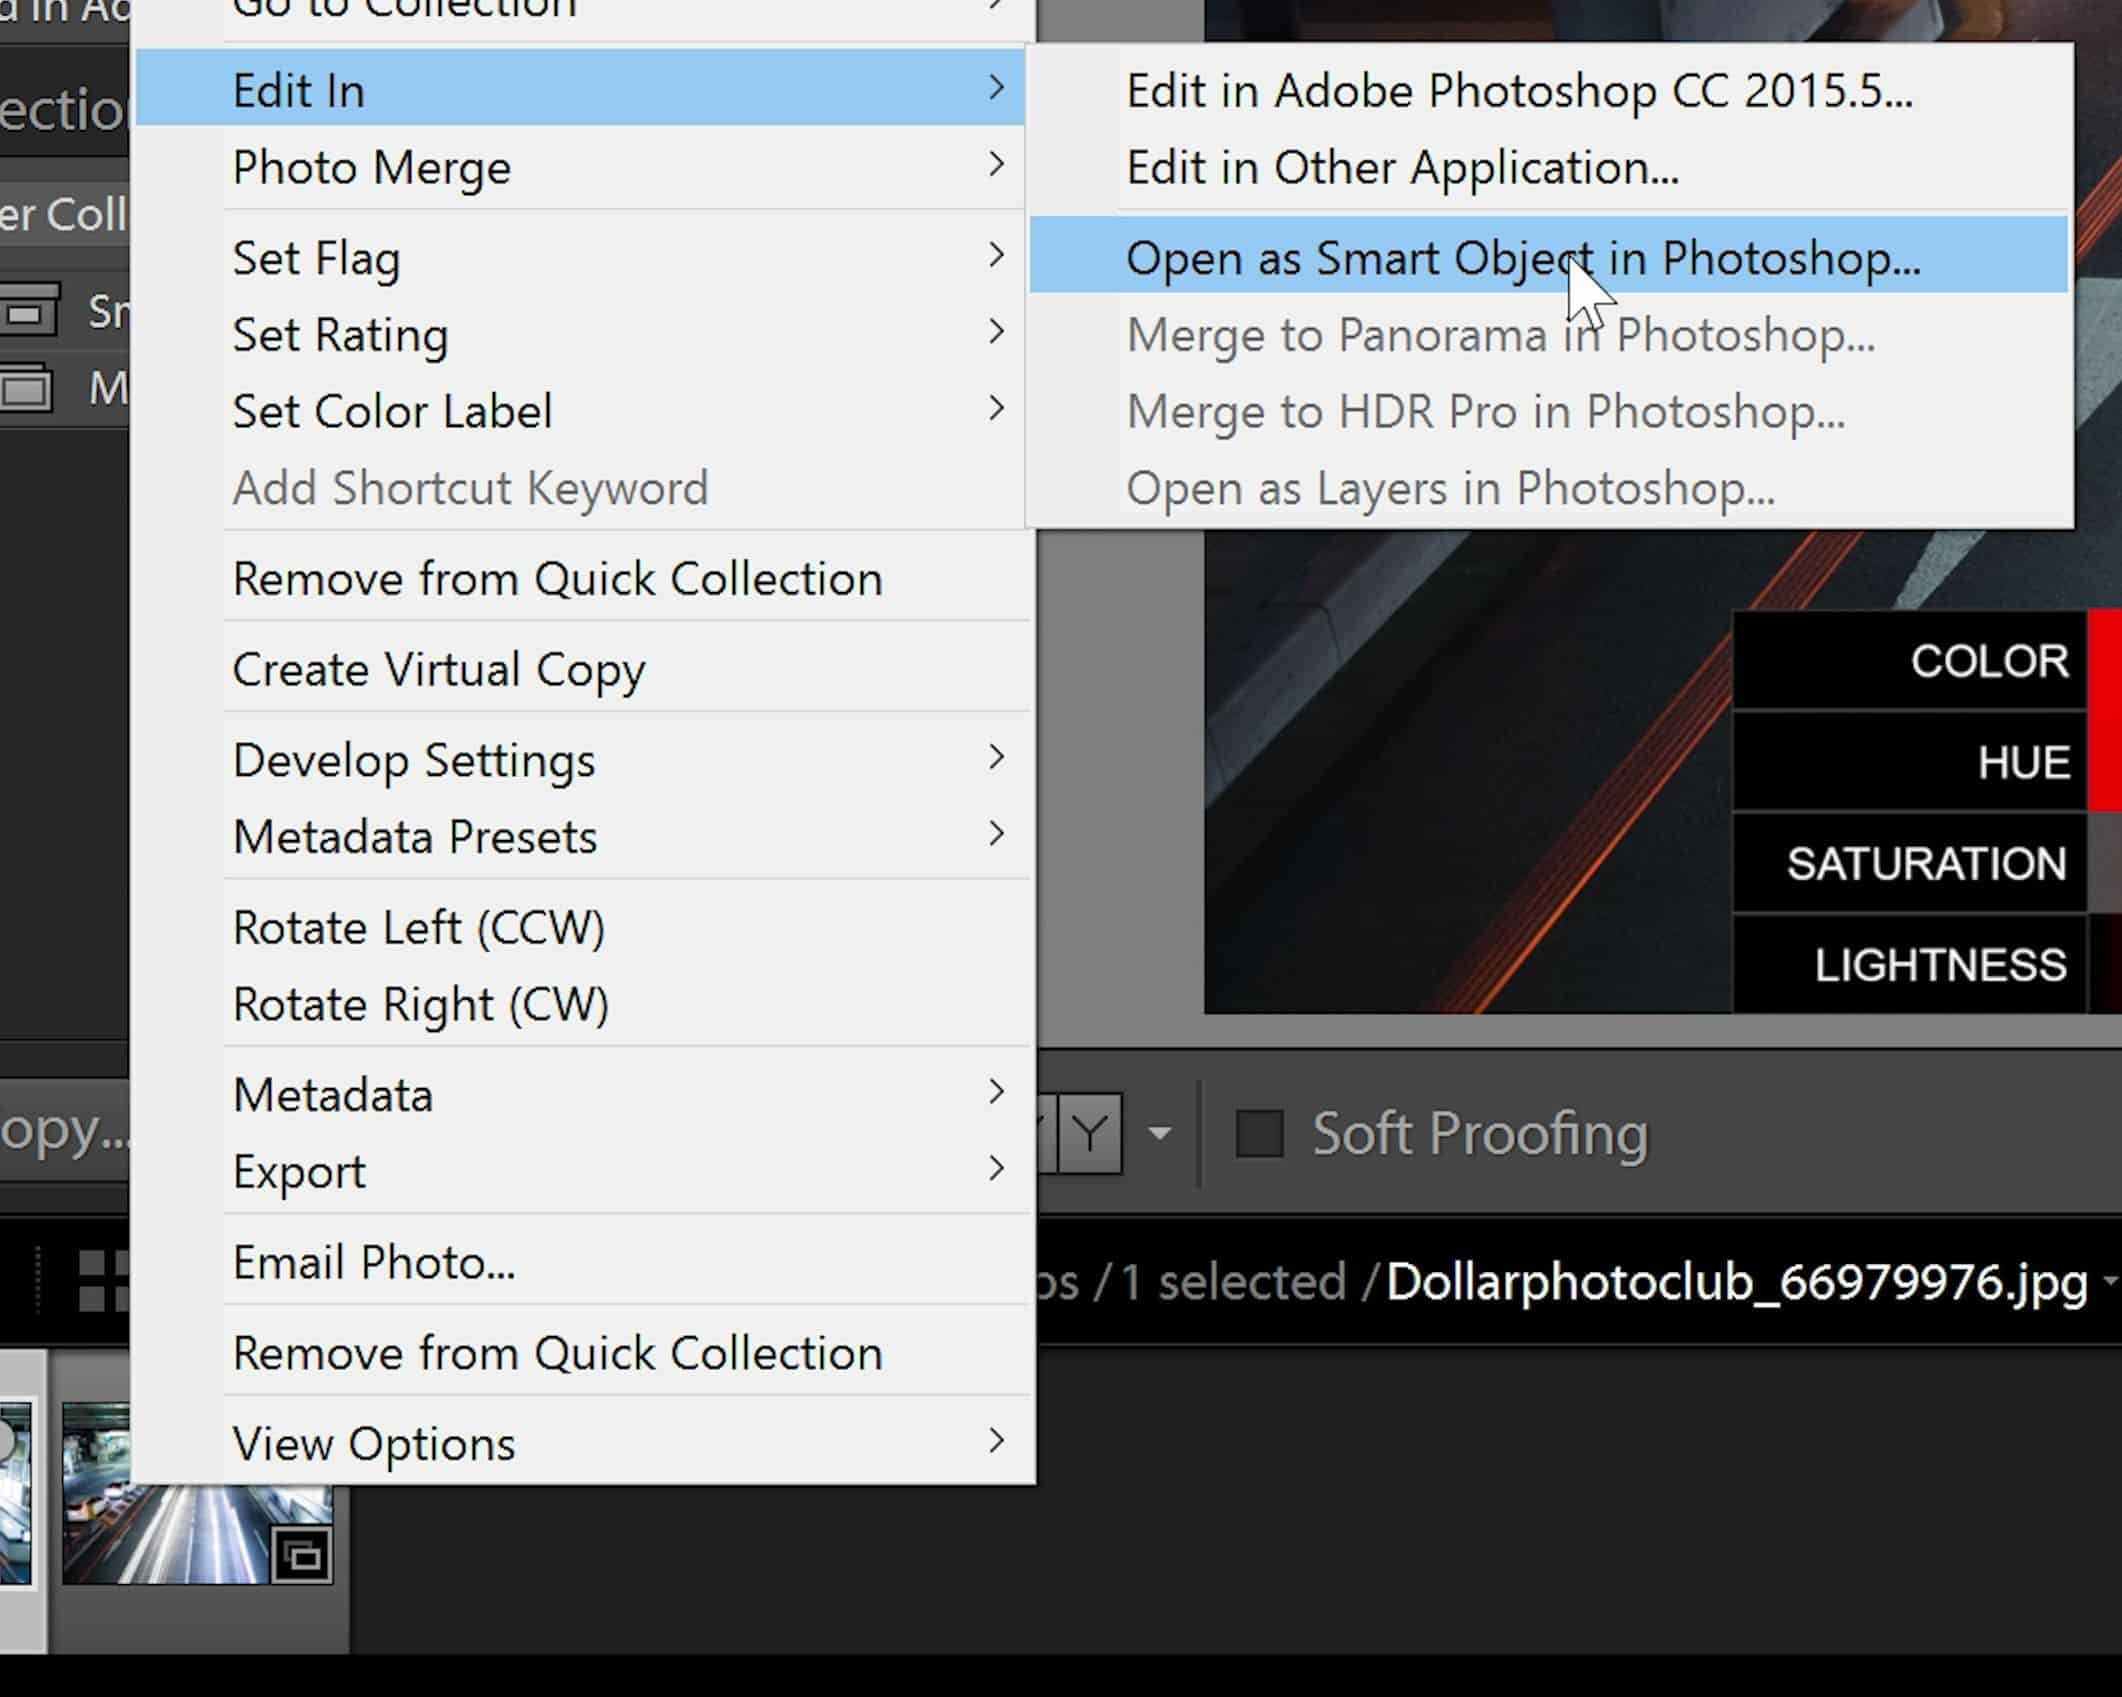
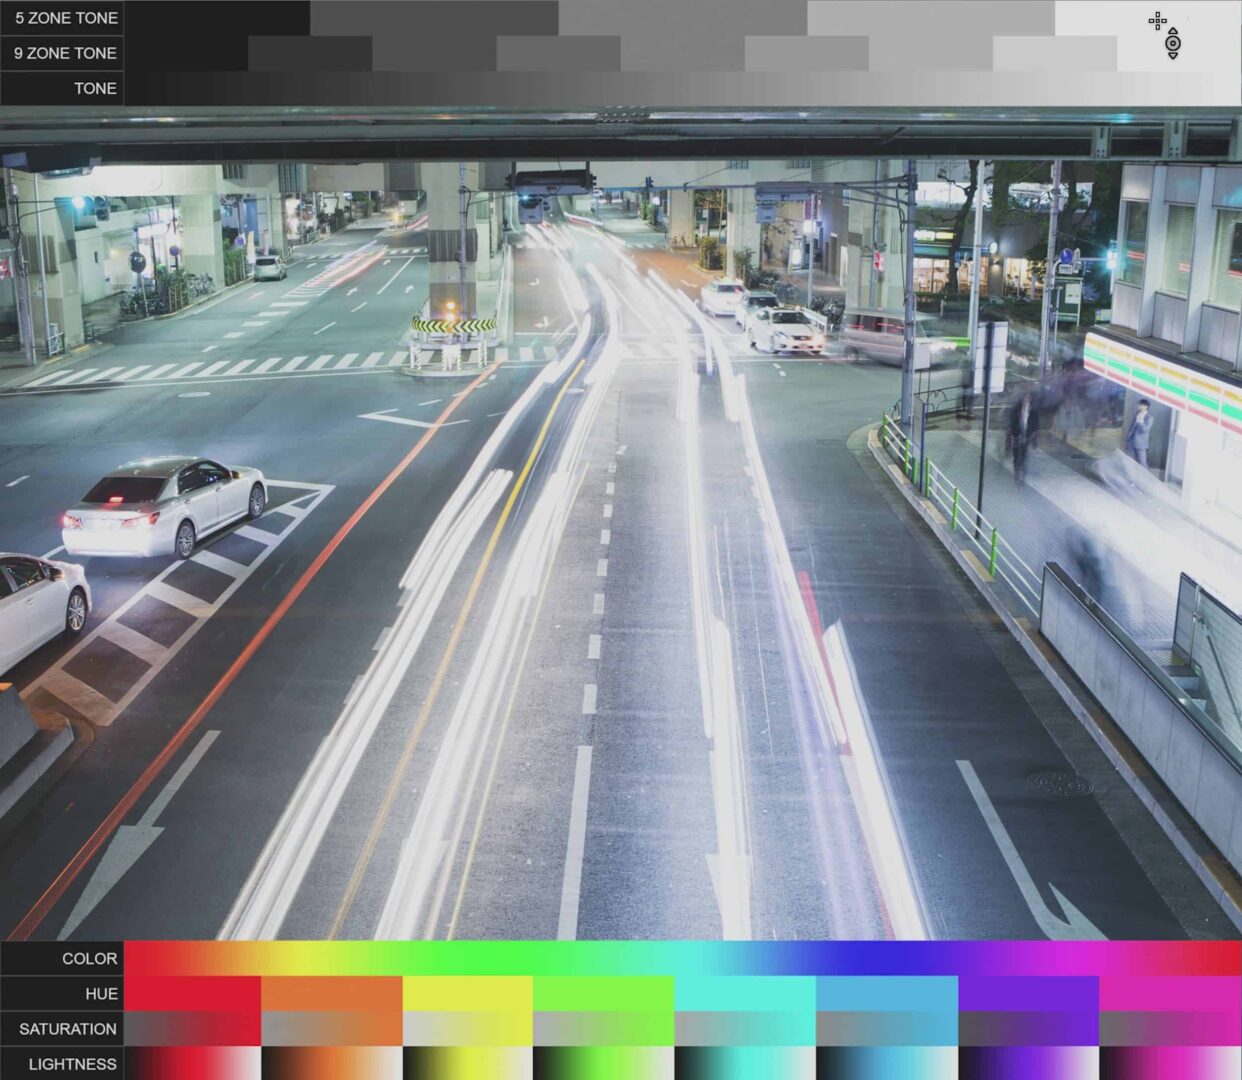
But to use the chart in Lightroom, you’ll first need to place a photo of your choice inside the chart. If you have a photo in Lightroom, you can just right-click on the thumbnail and go to Edit In > Open as Smart Object in Photoshop, and then place the tone chart over your photo.
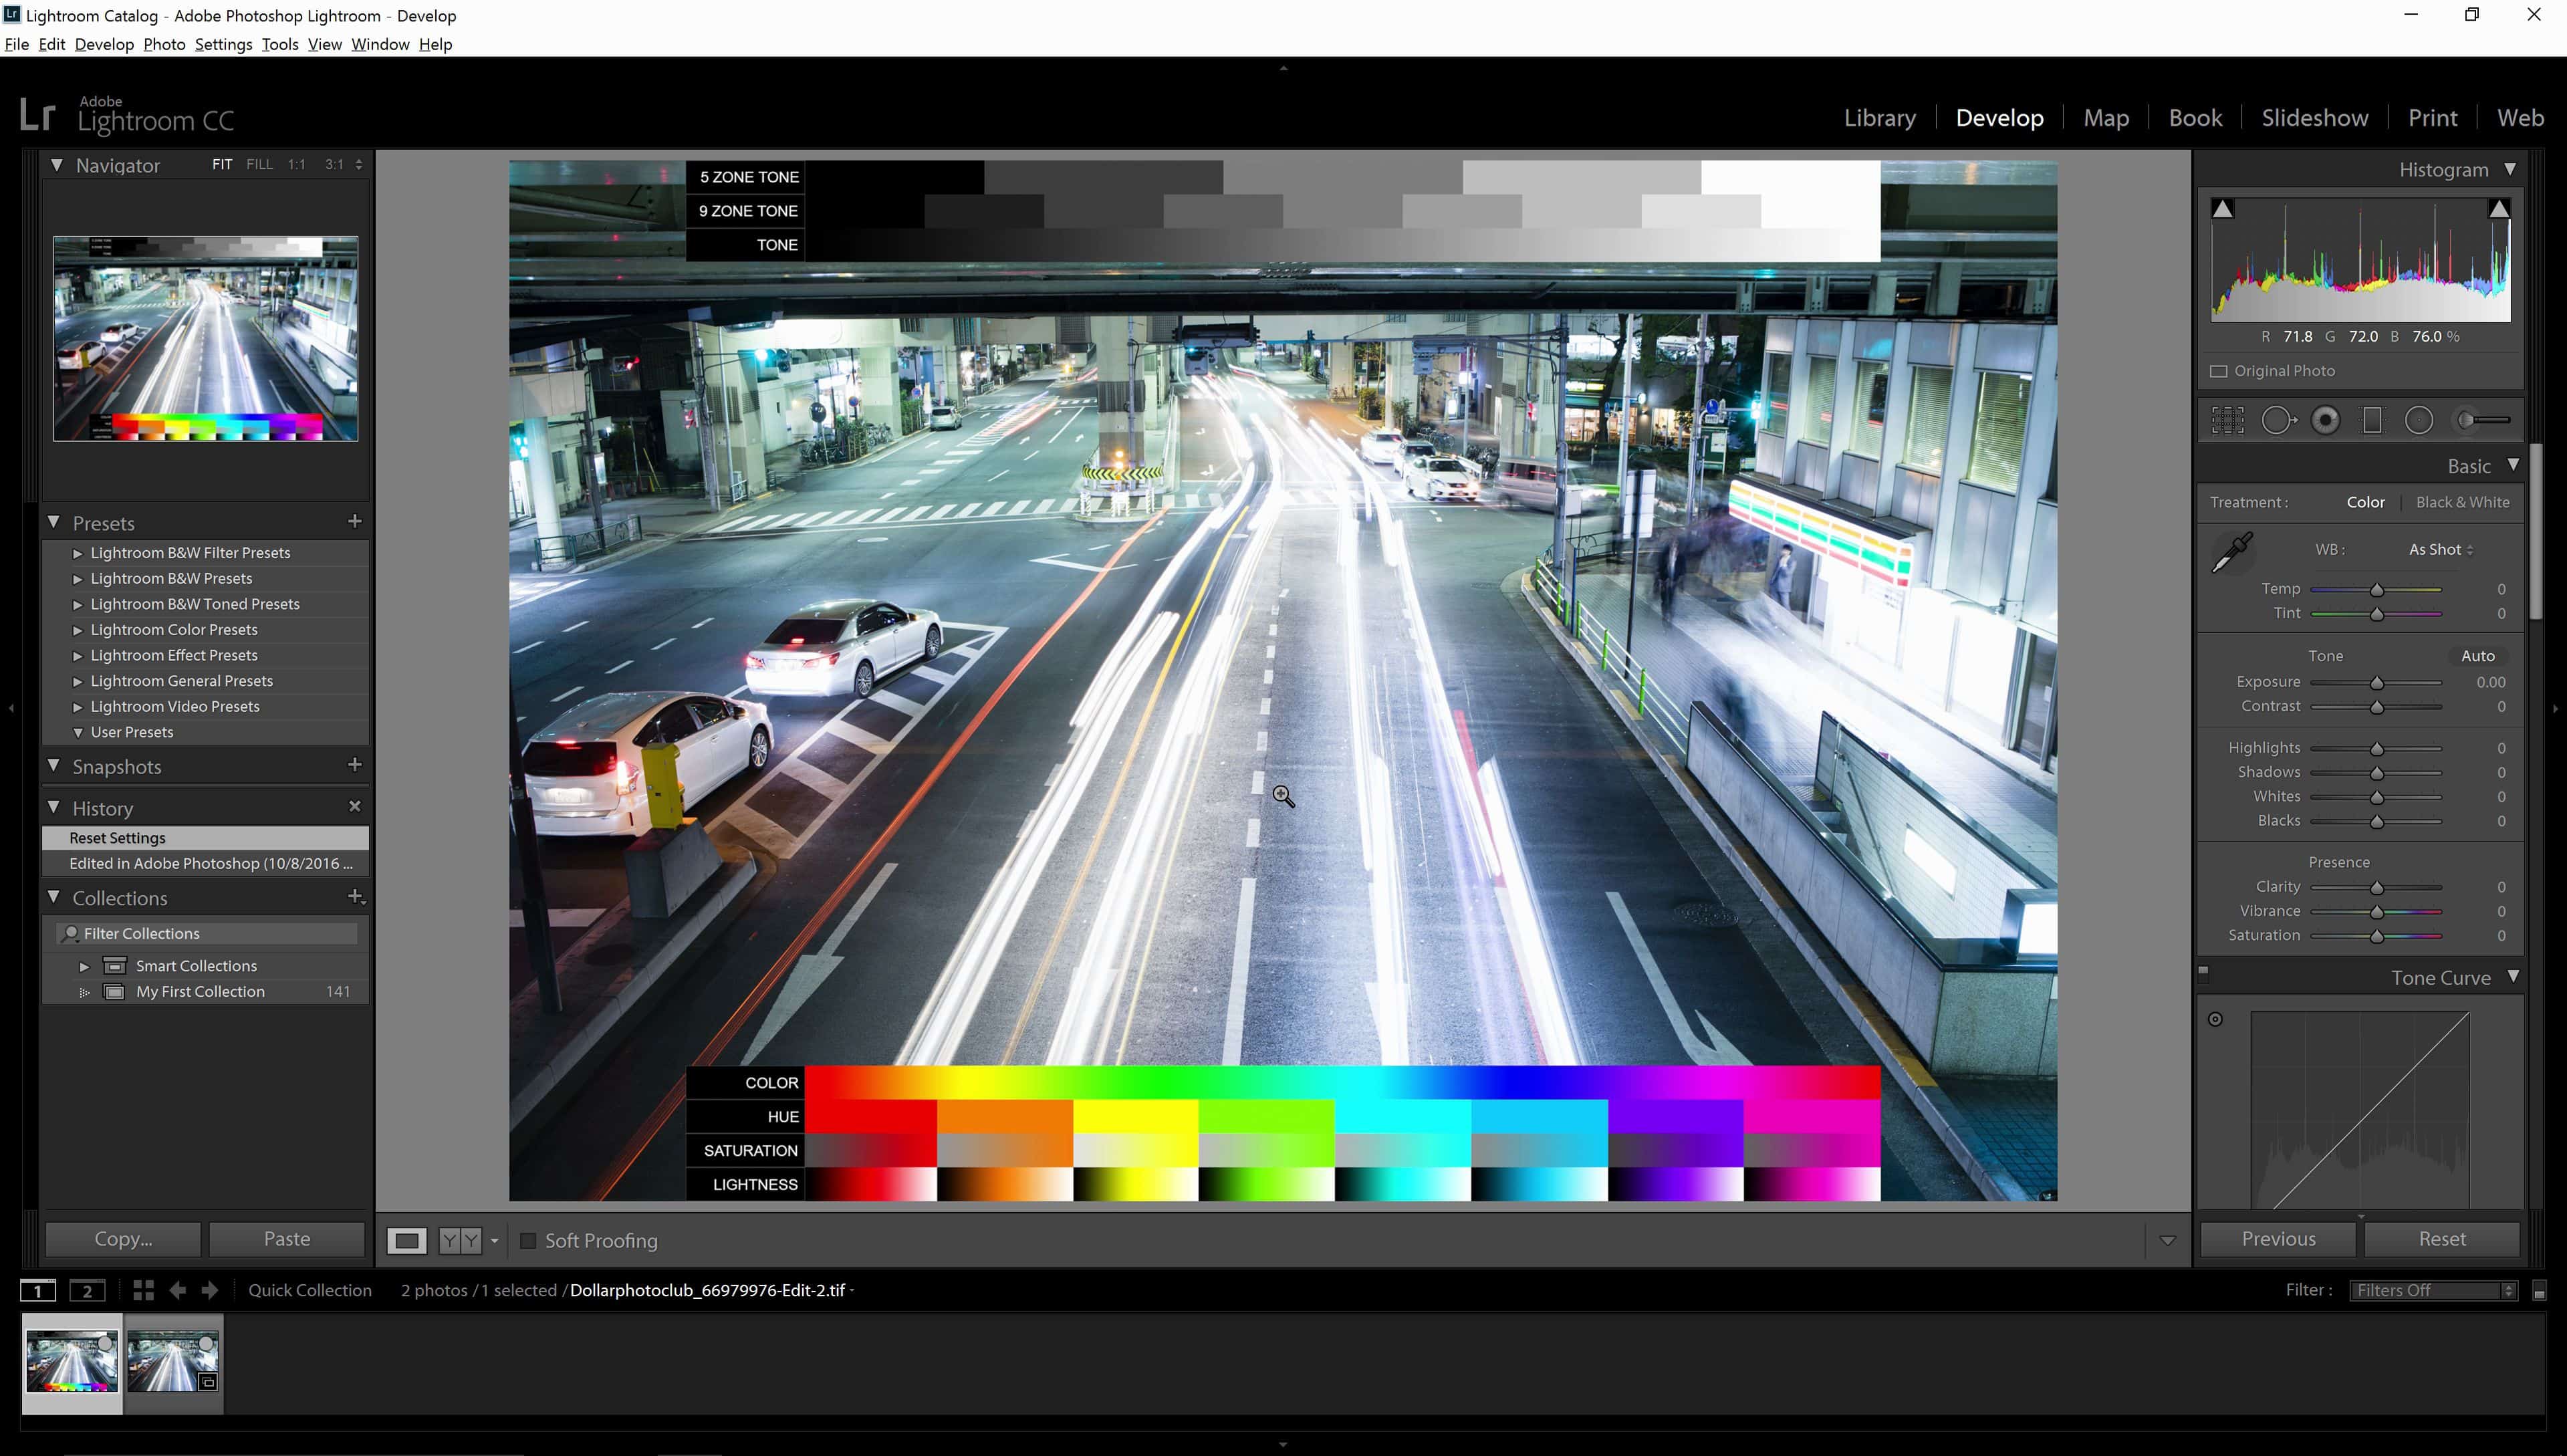
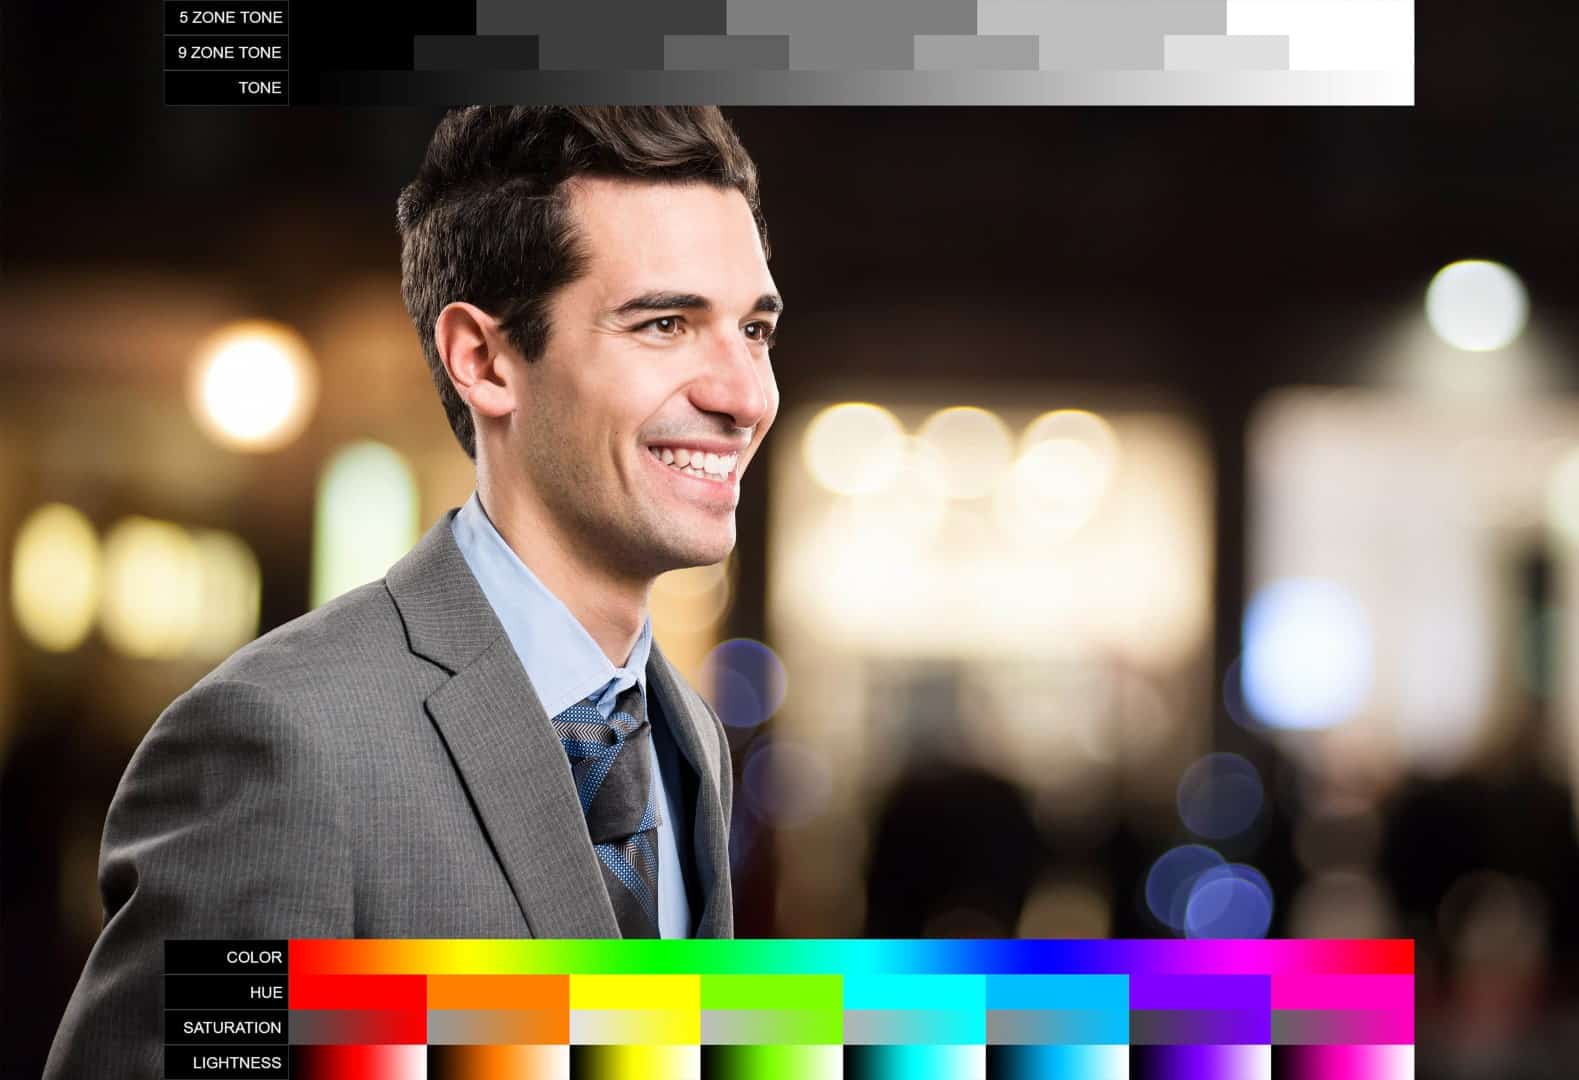
You can use any image editing software to do this but I already have one done here. When you have your image loaded, switch to the Develop mode.
Basically this chart lets you see what you’re doing when you use the tone curve and the color adjustments. Let’s start with the tone. The tone chart makes using the tone curve way easier and more accurate than it is to do by hand. If you haven’t seen the previous video on how to use the tone chart, make sure you watch that first. It’s for Photoshop but it has some great tips on how to use the tone chart and how you can use it to create a lot of different effects.
Step 3
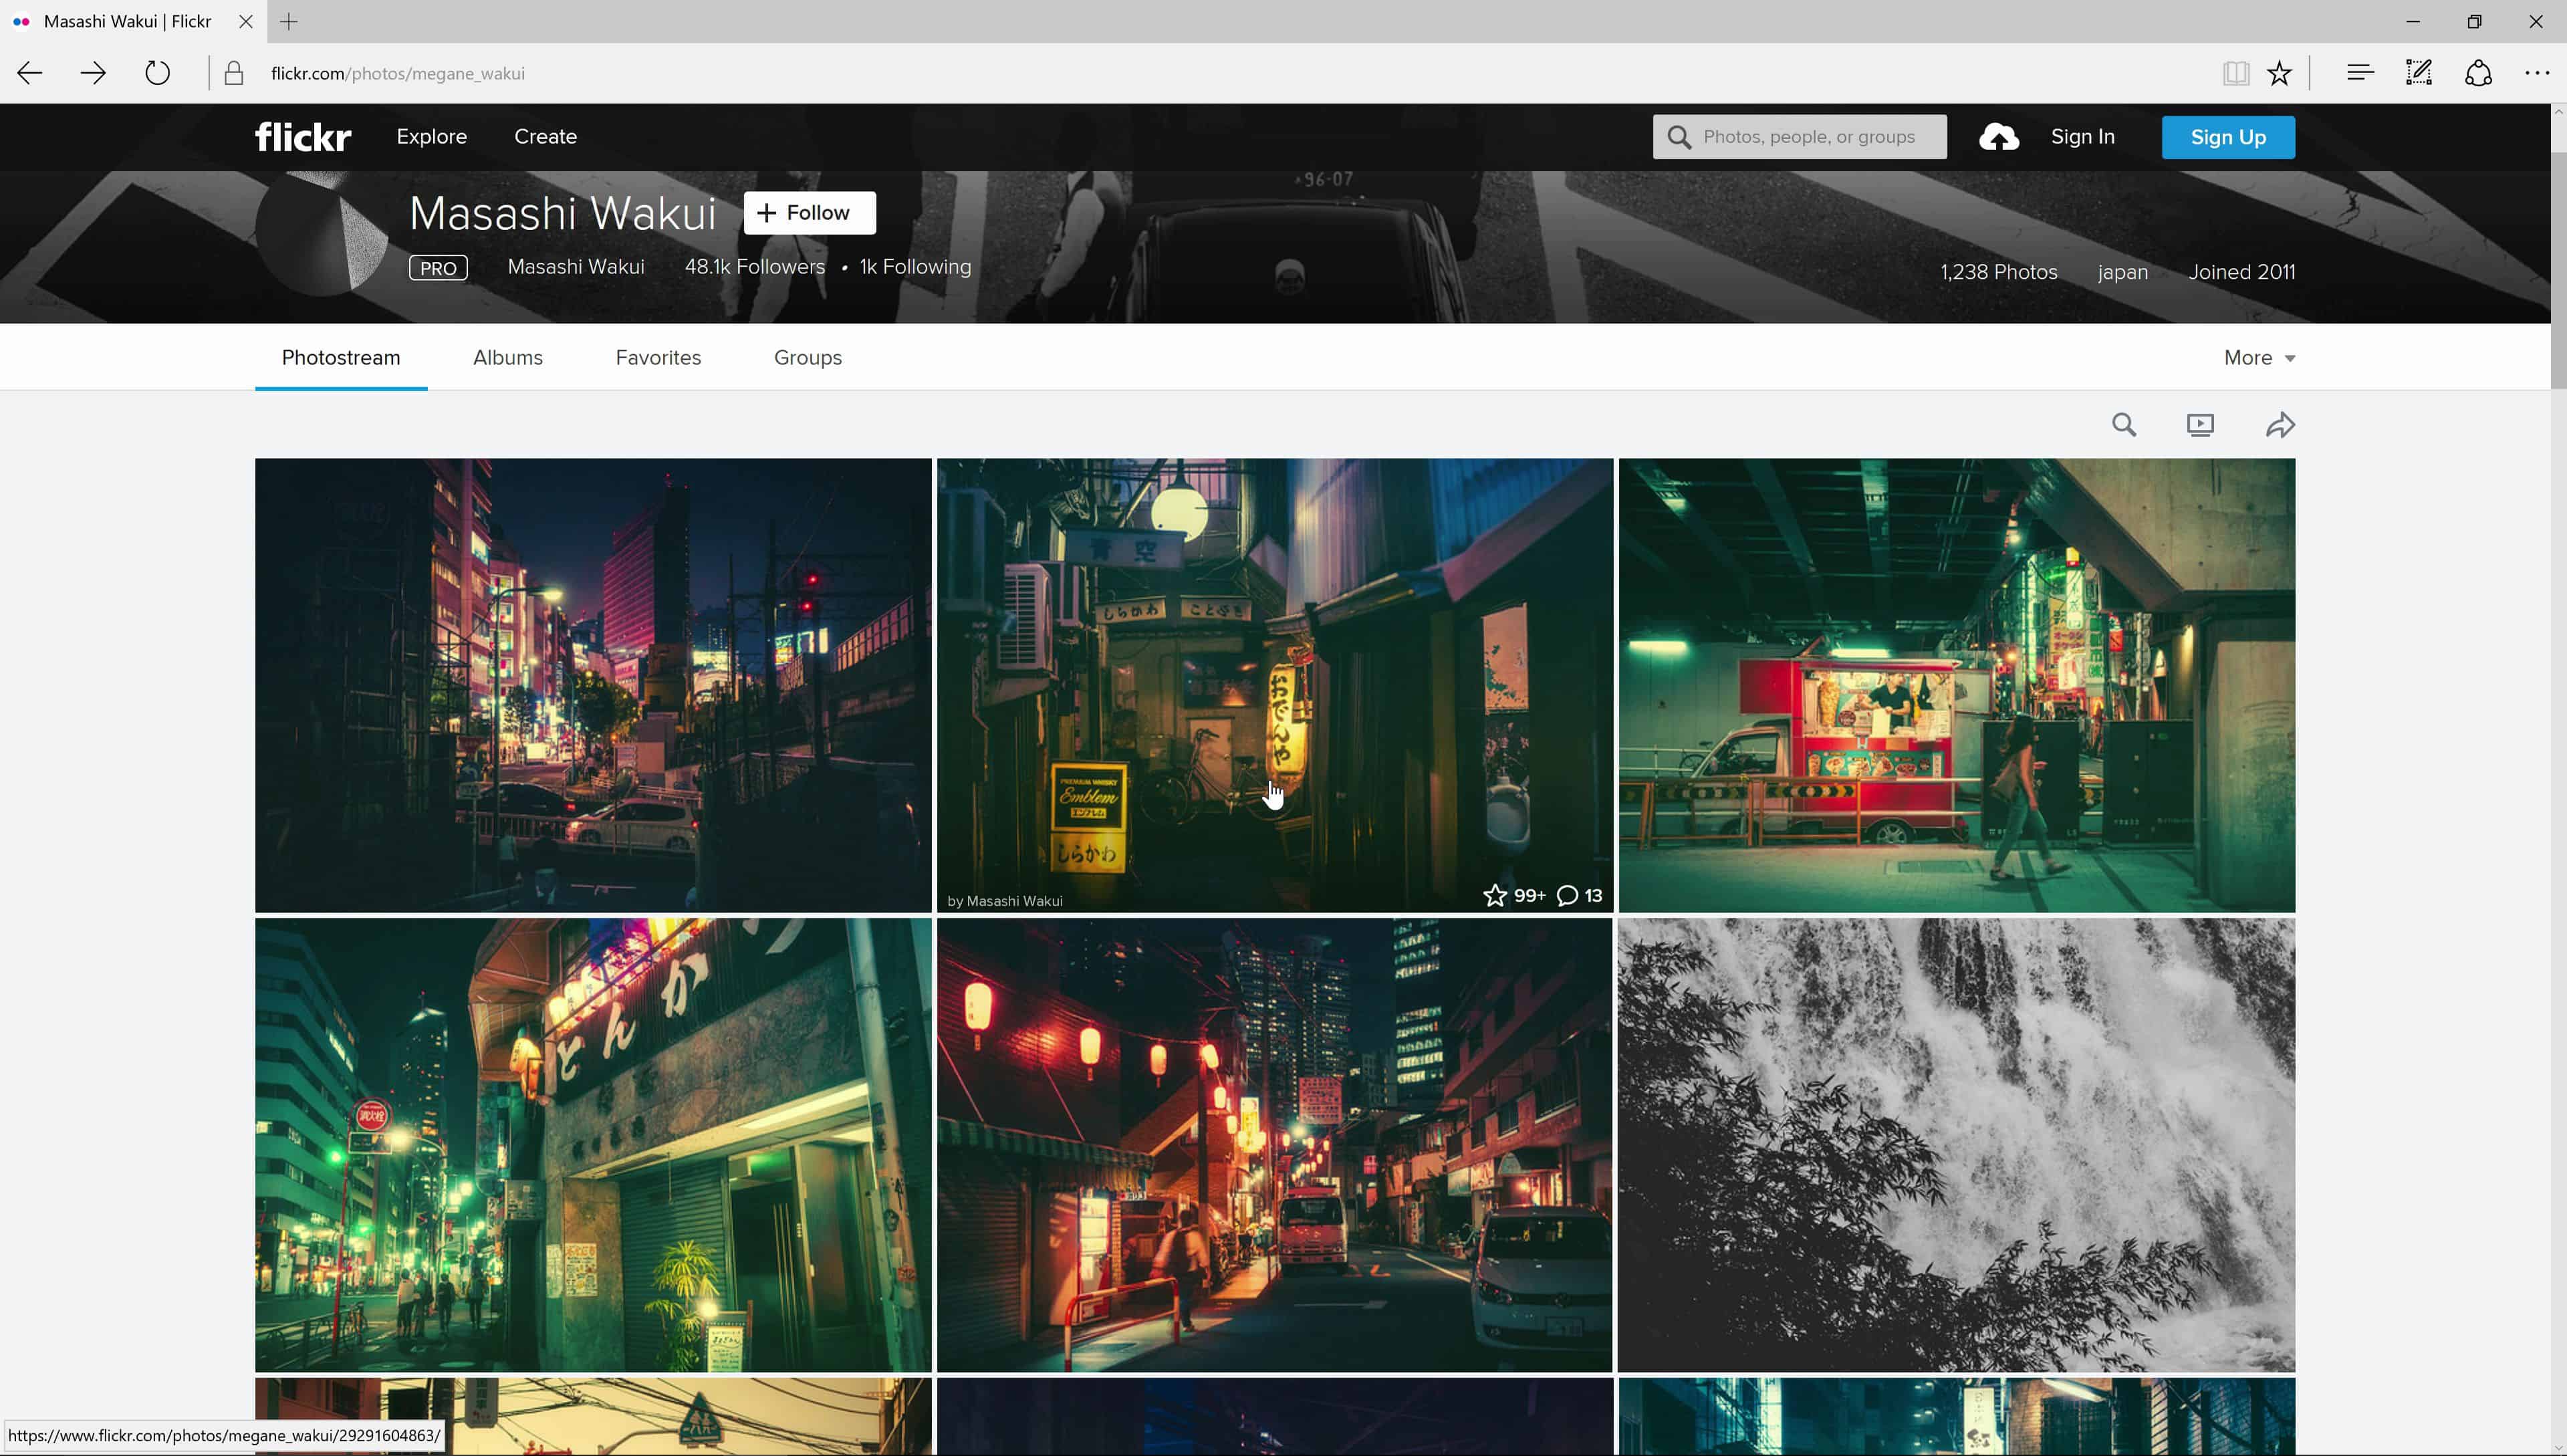
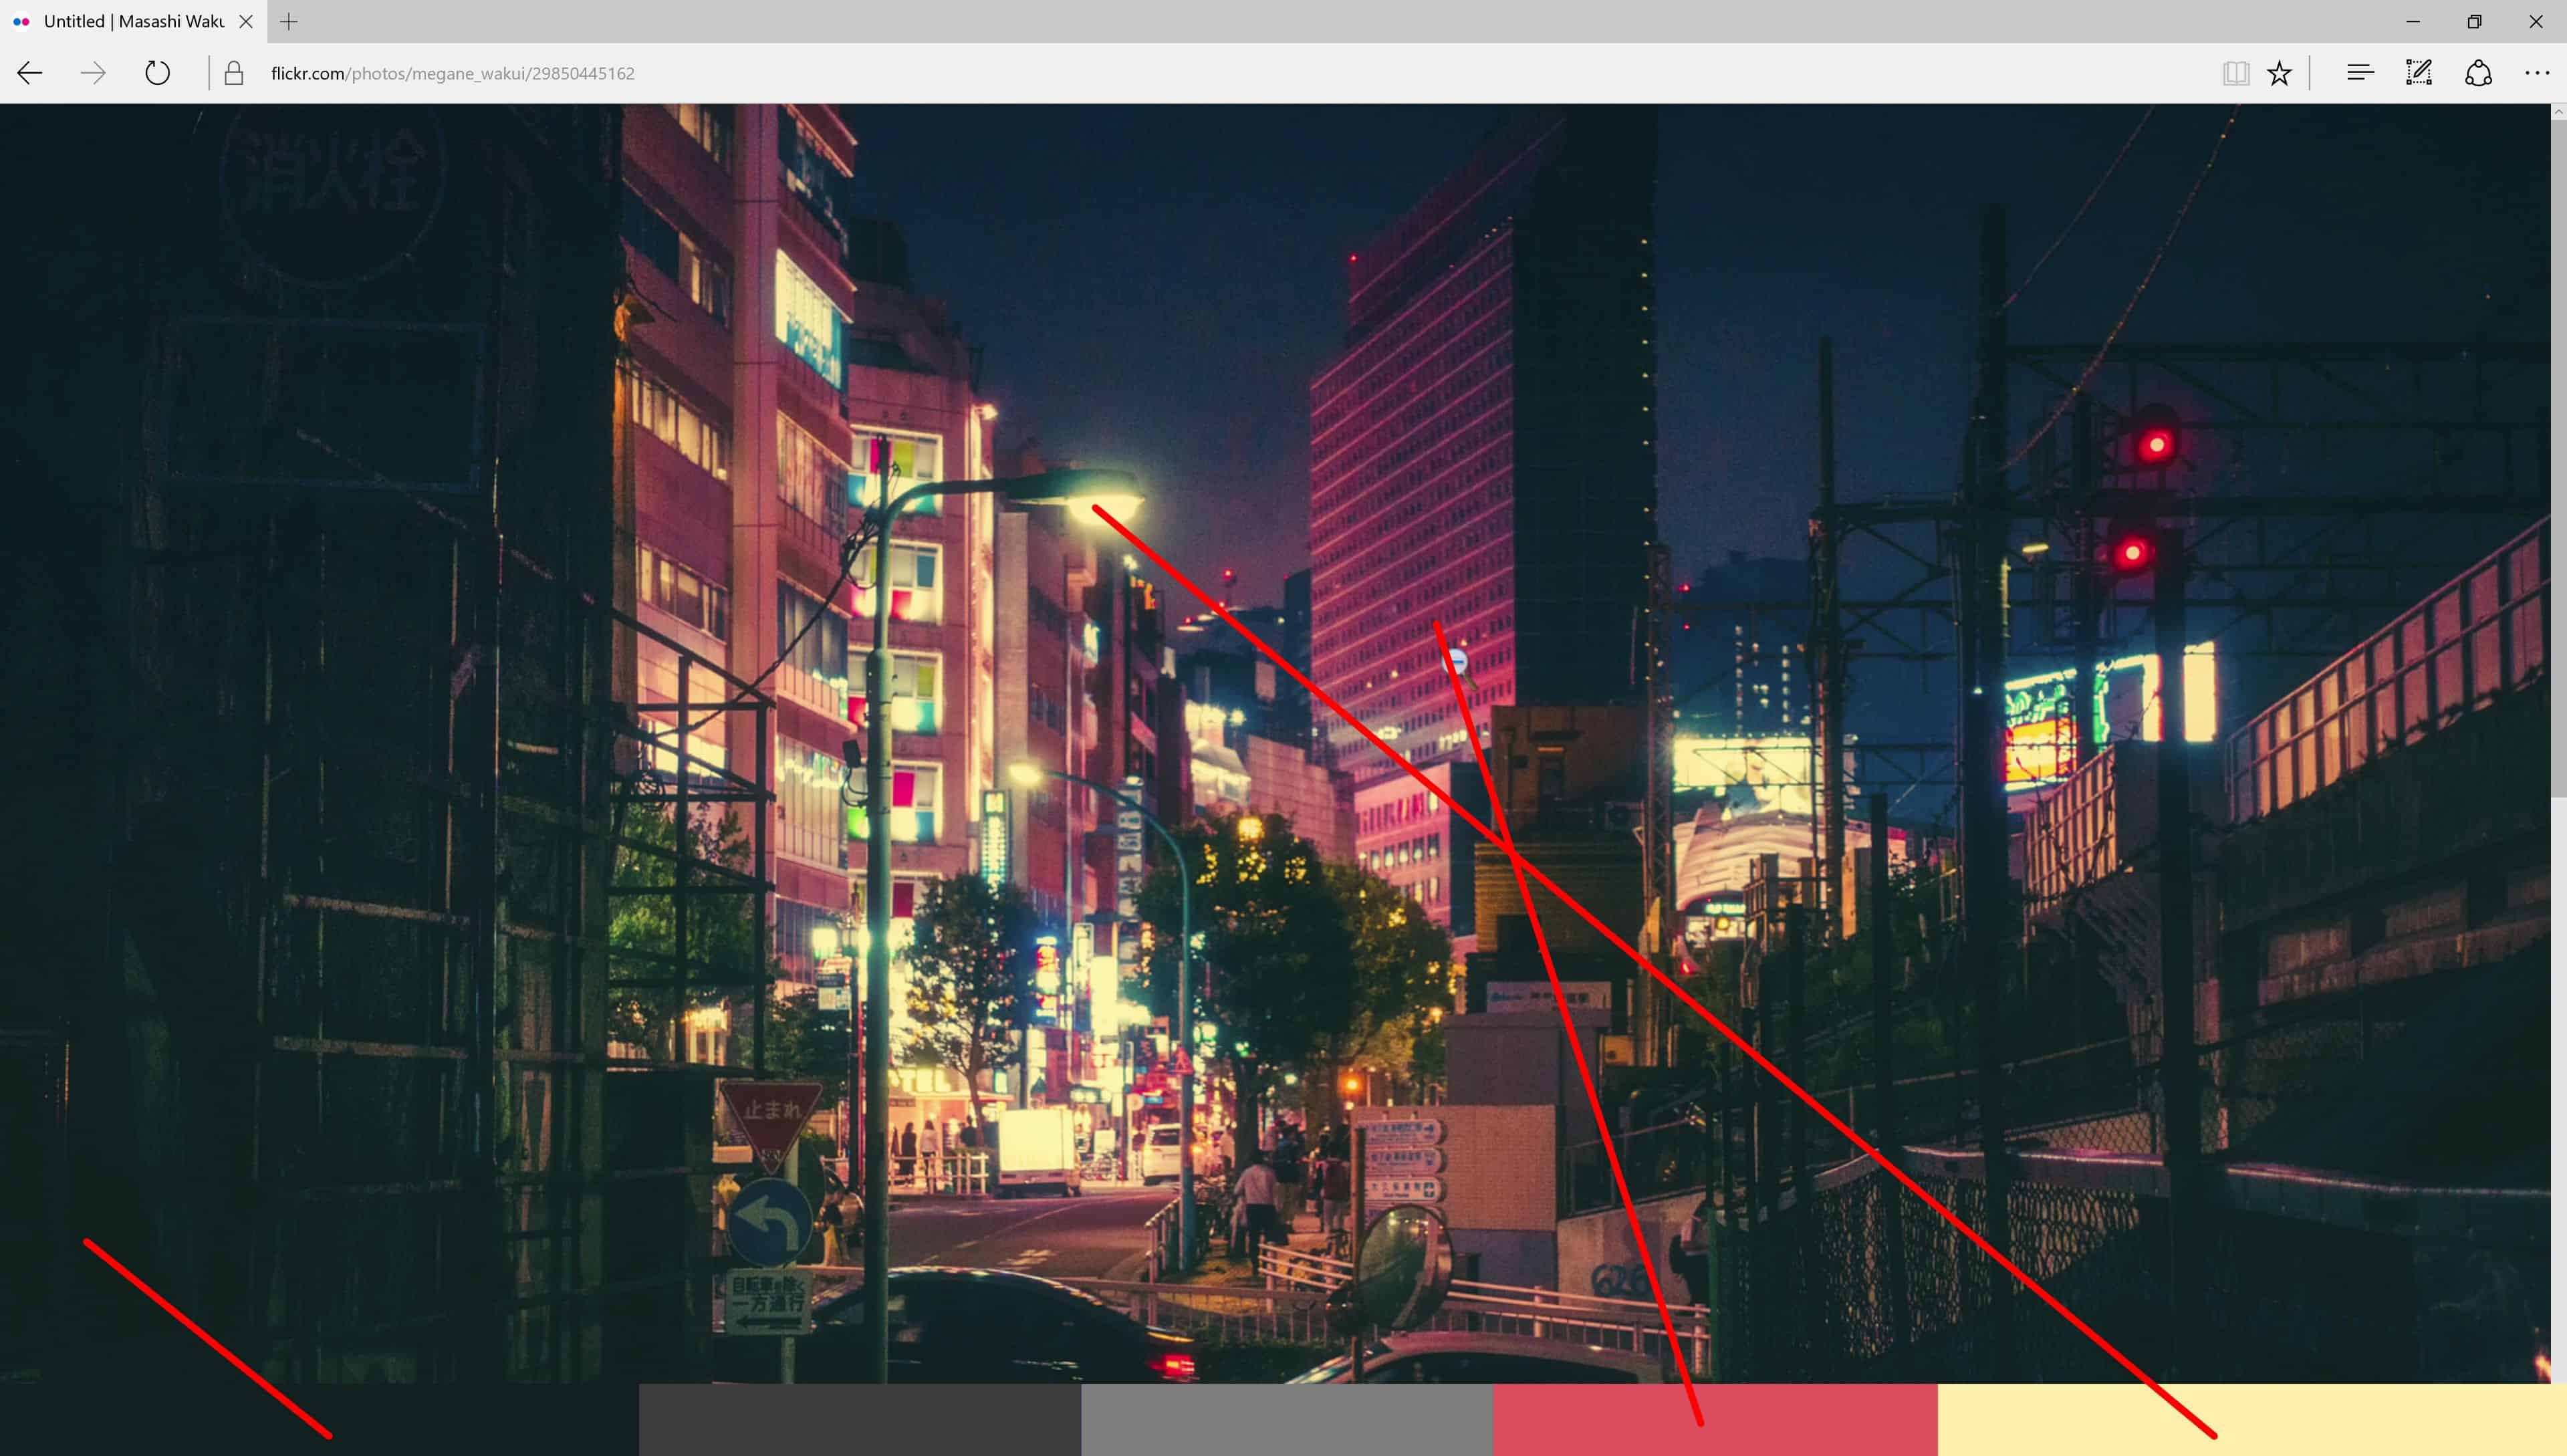
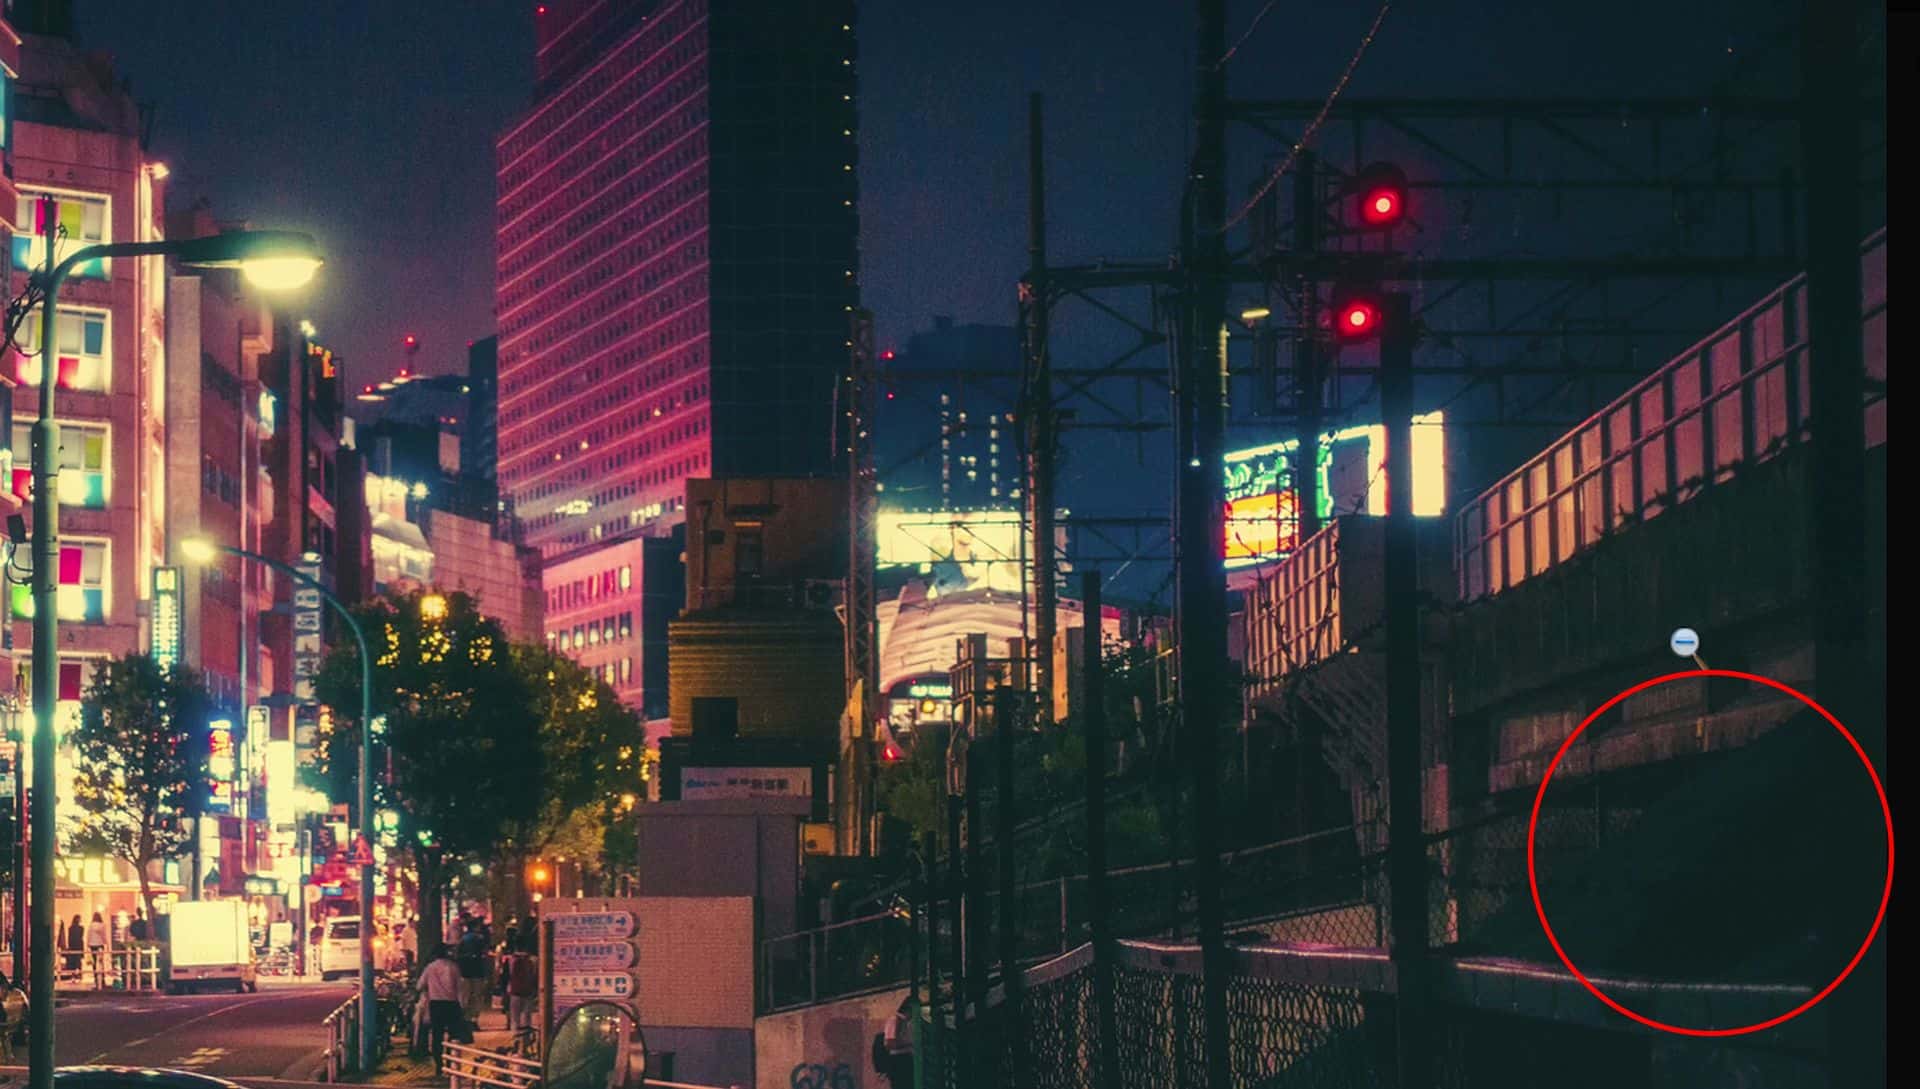
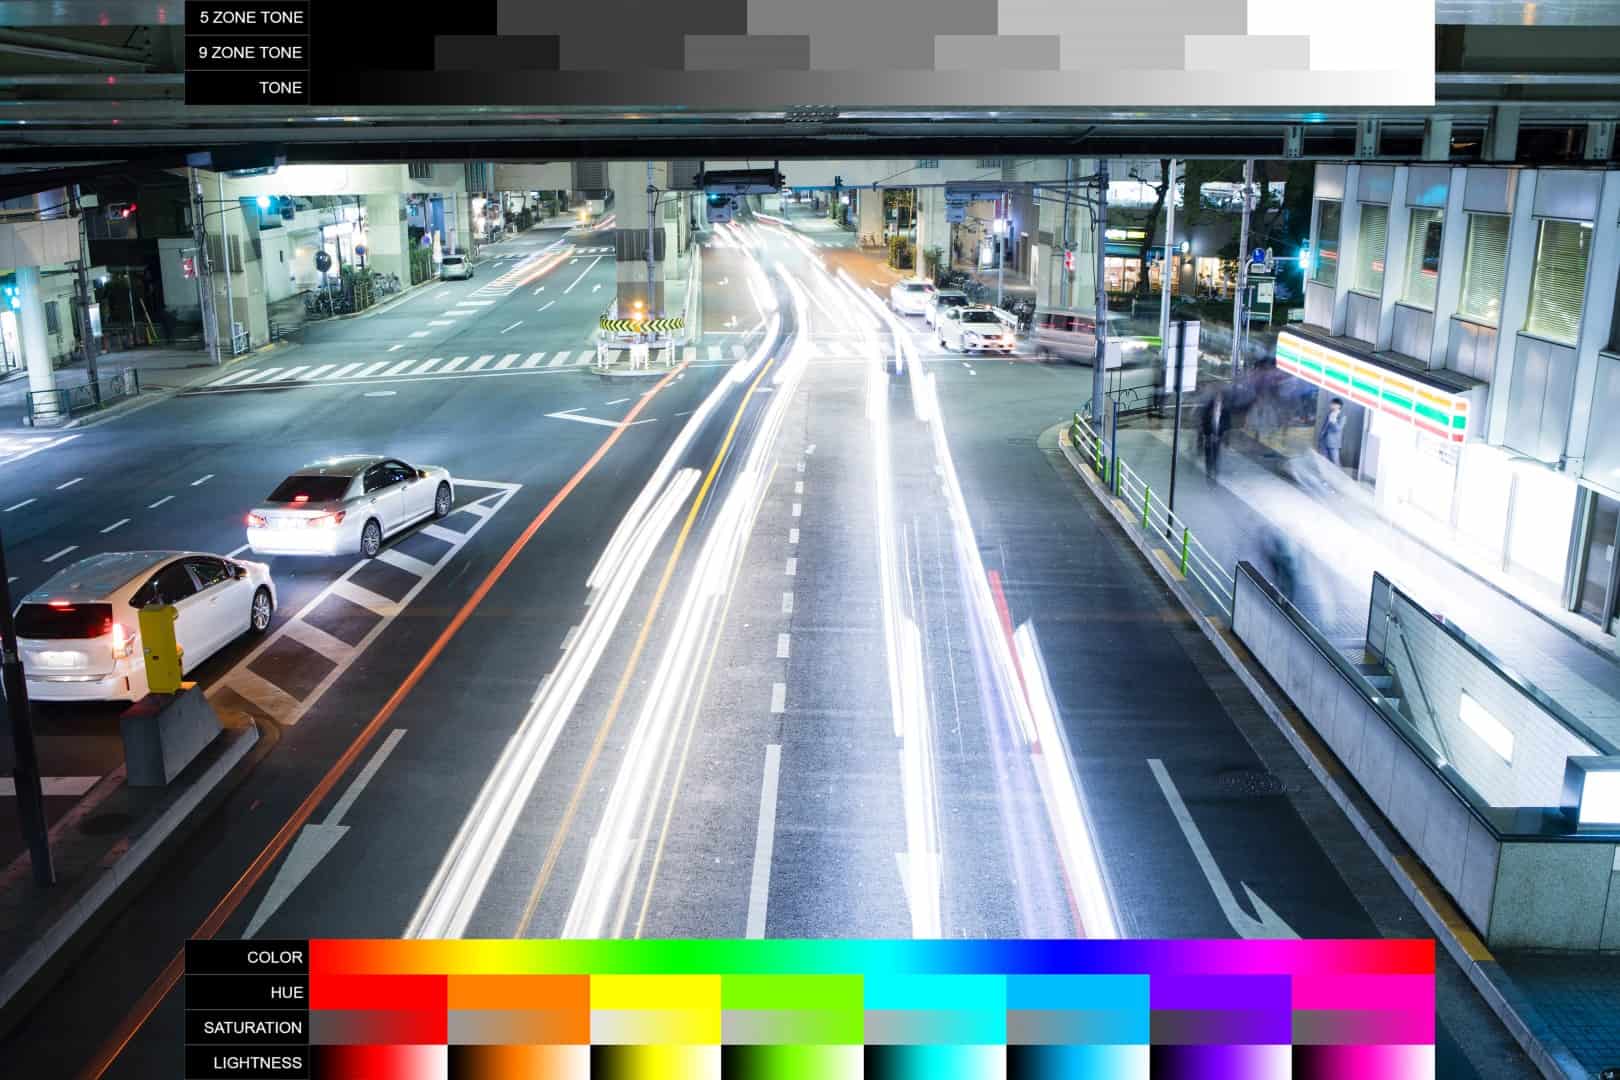
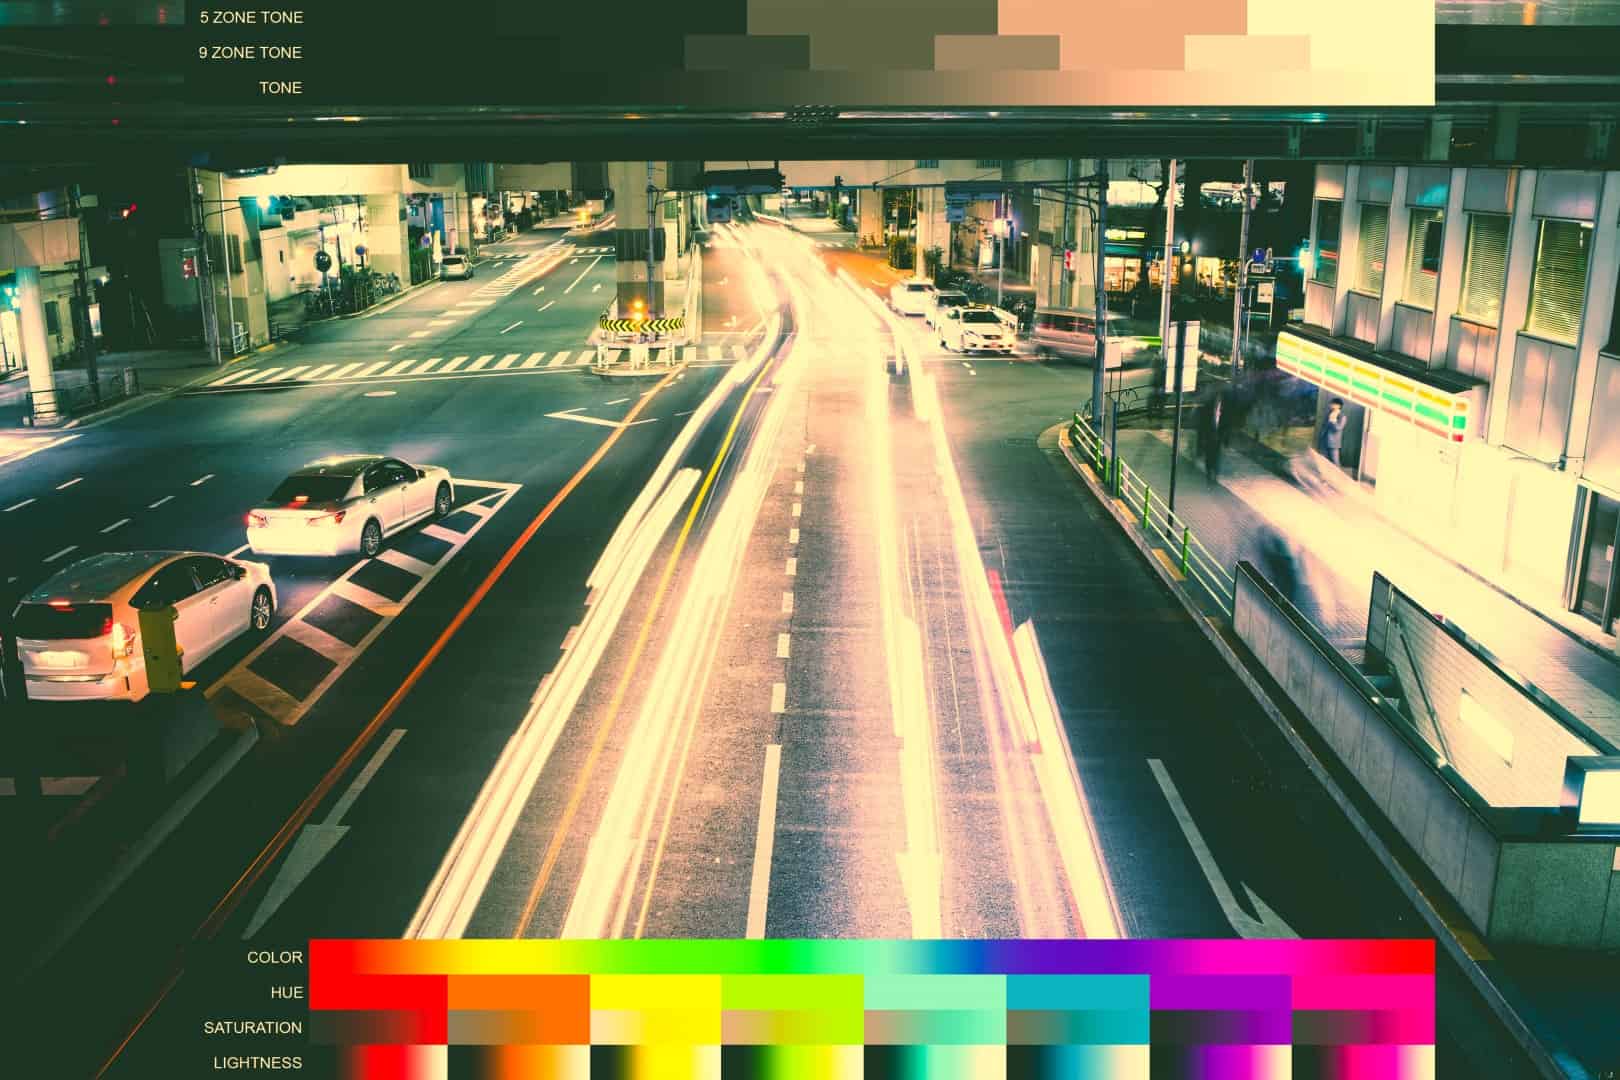
For this tutorial, I’m going to create an effect similar to one of my favorite photographers – Masashi Wakui. He takes amazing photos but what really makes the photos stand out is his post processing style. It’s very strong and noticeable and it also happens to be very suitable for this tutorial.
Just a note, this chart is useful even if you’re creating very subtle effects like film looks. You can also use it to experiment and come up with your own effects from scratch instead of doing what I’m doing and trying to replicate someone else’s effect. But as a demonstration, I’ll be replicating a stronger post processing style because it’ll be easier for you to see what’s happening.
Step 4
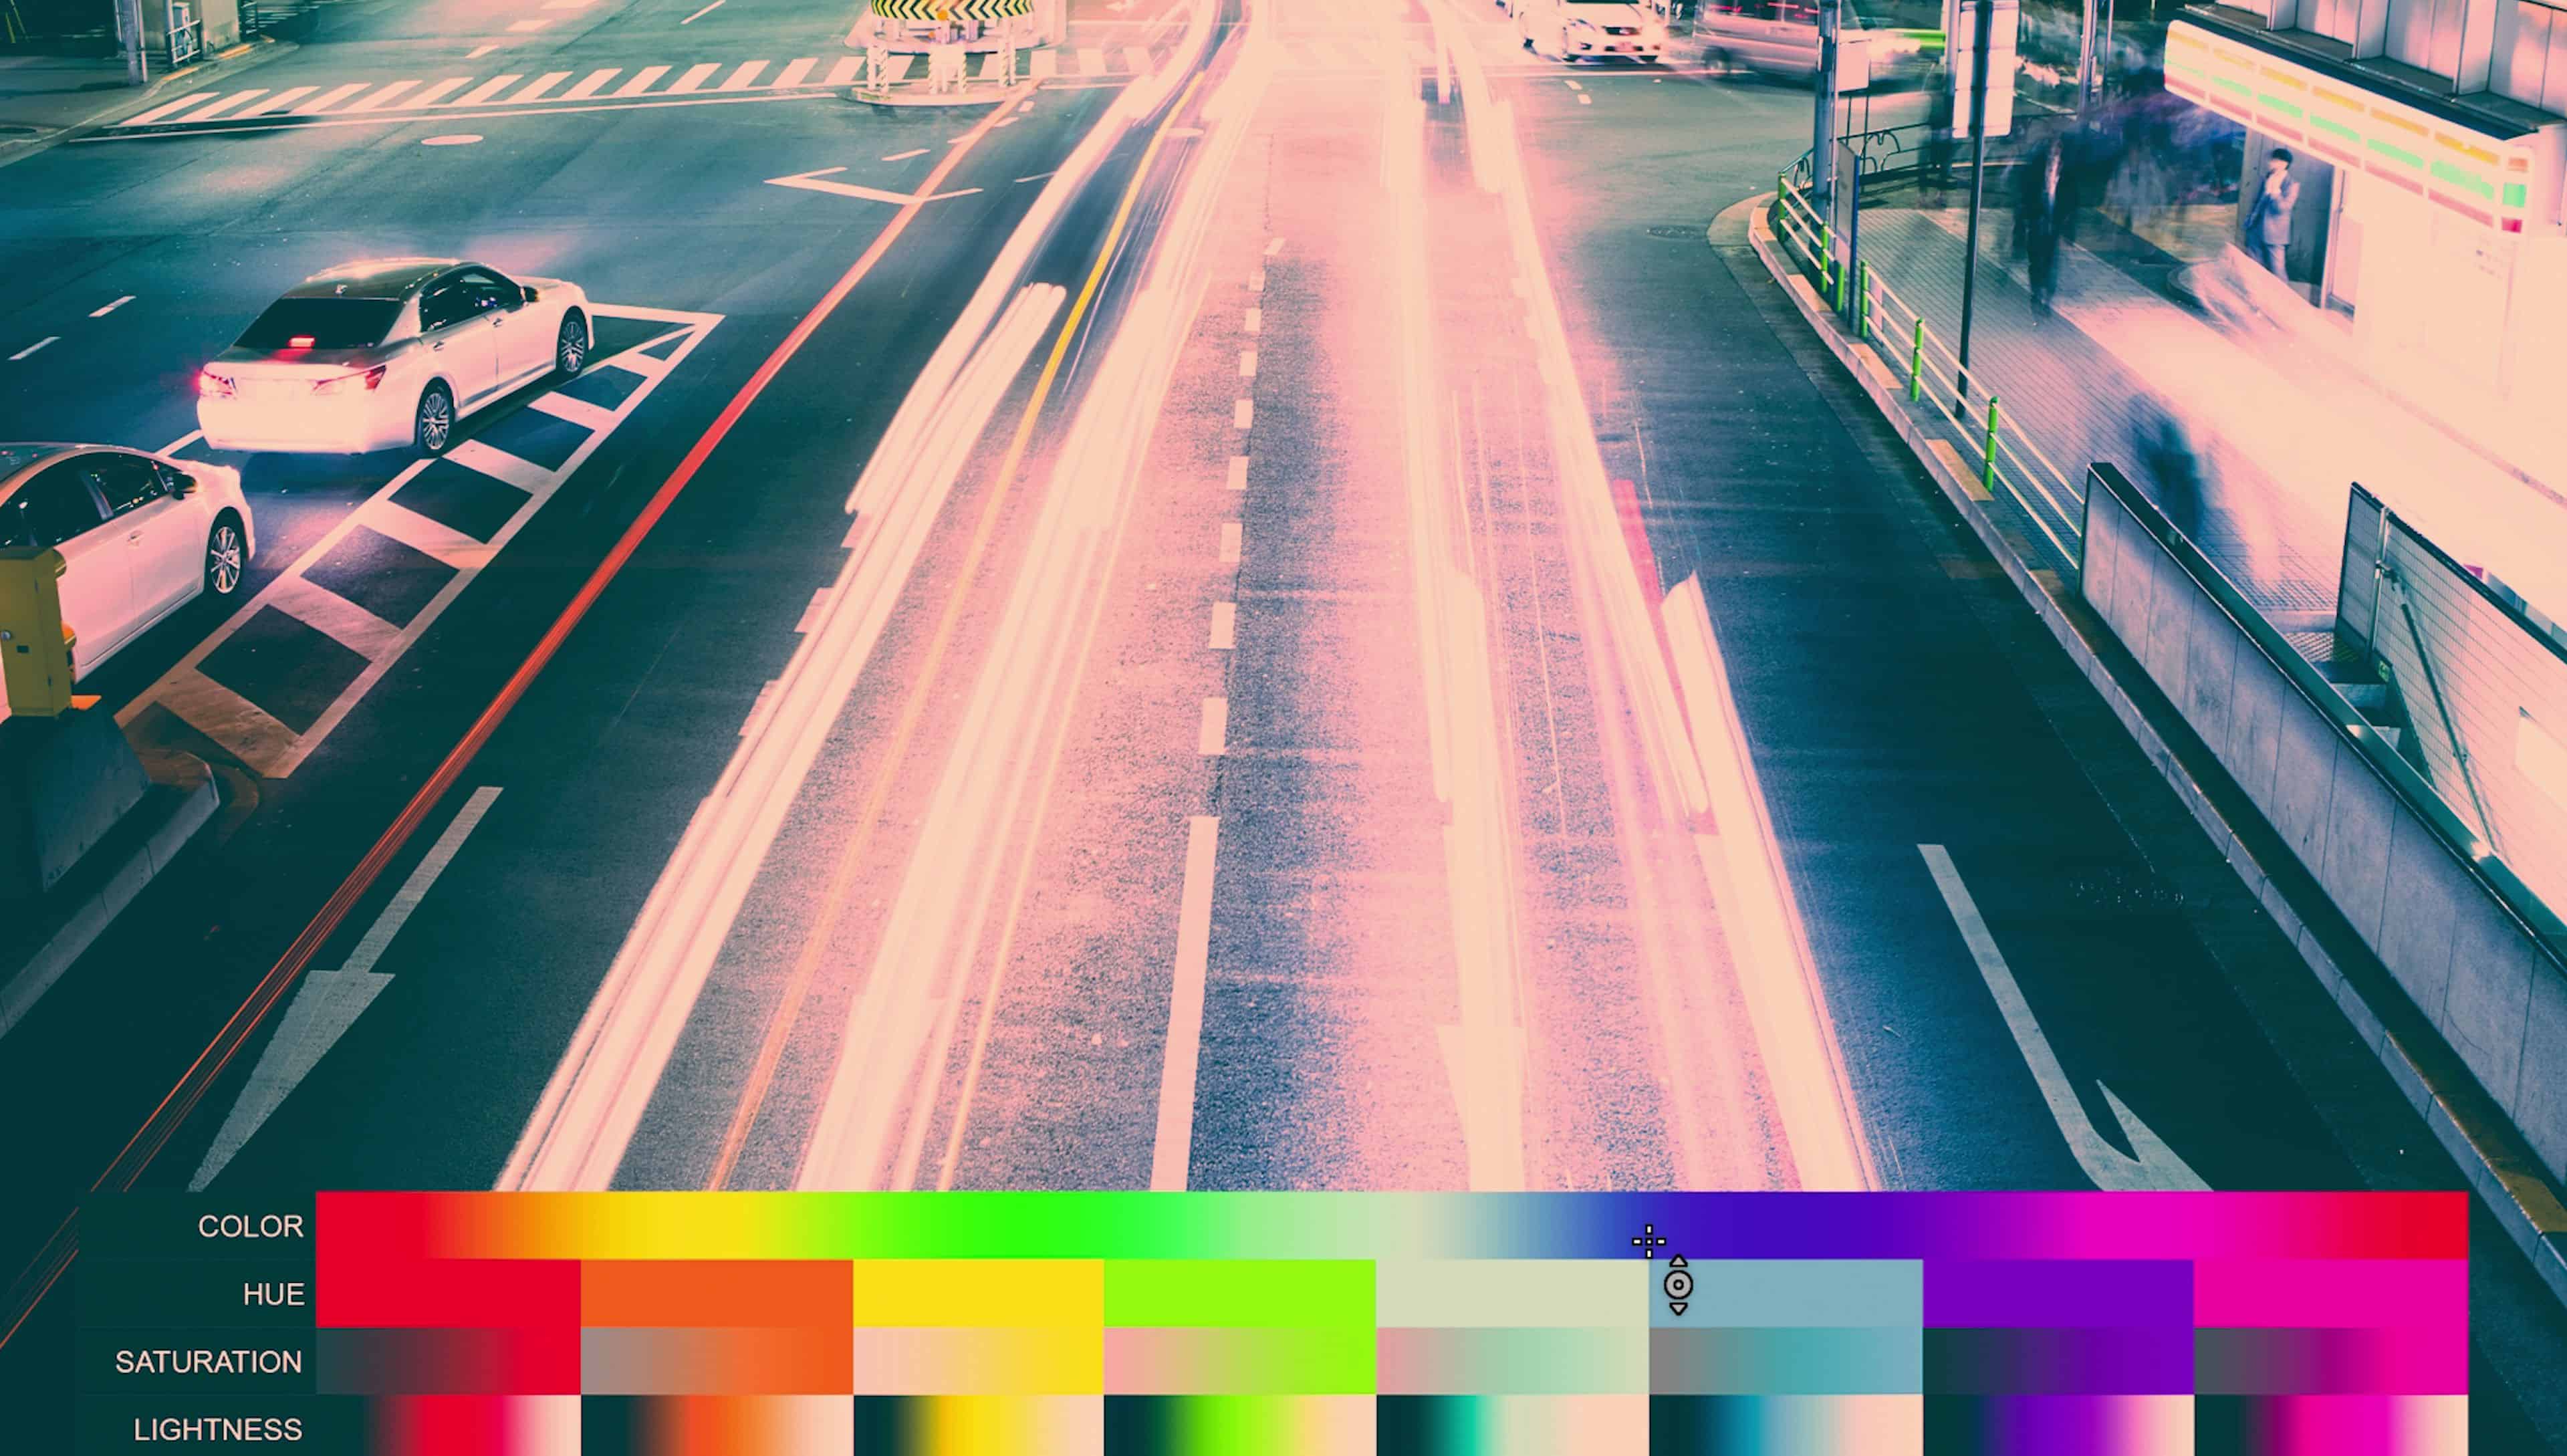
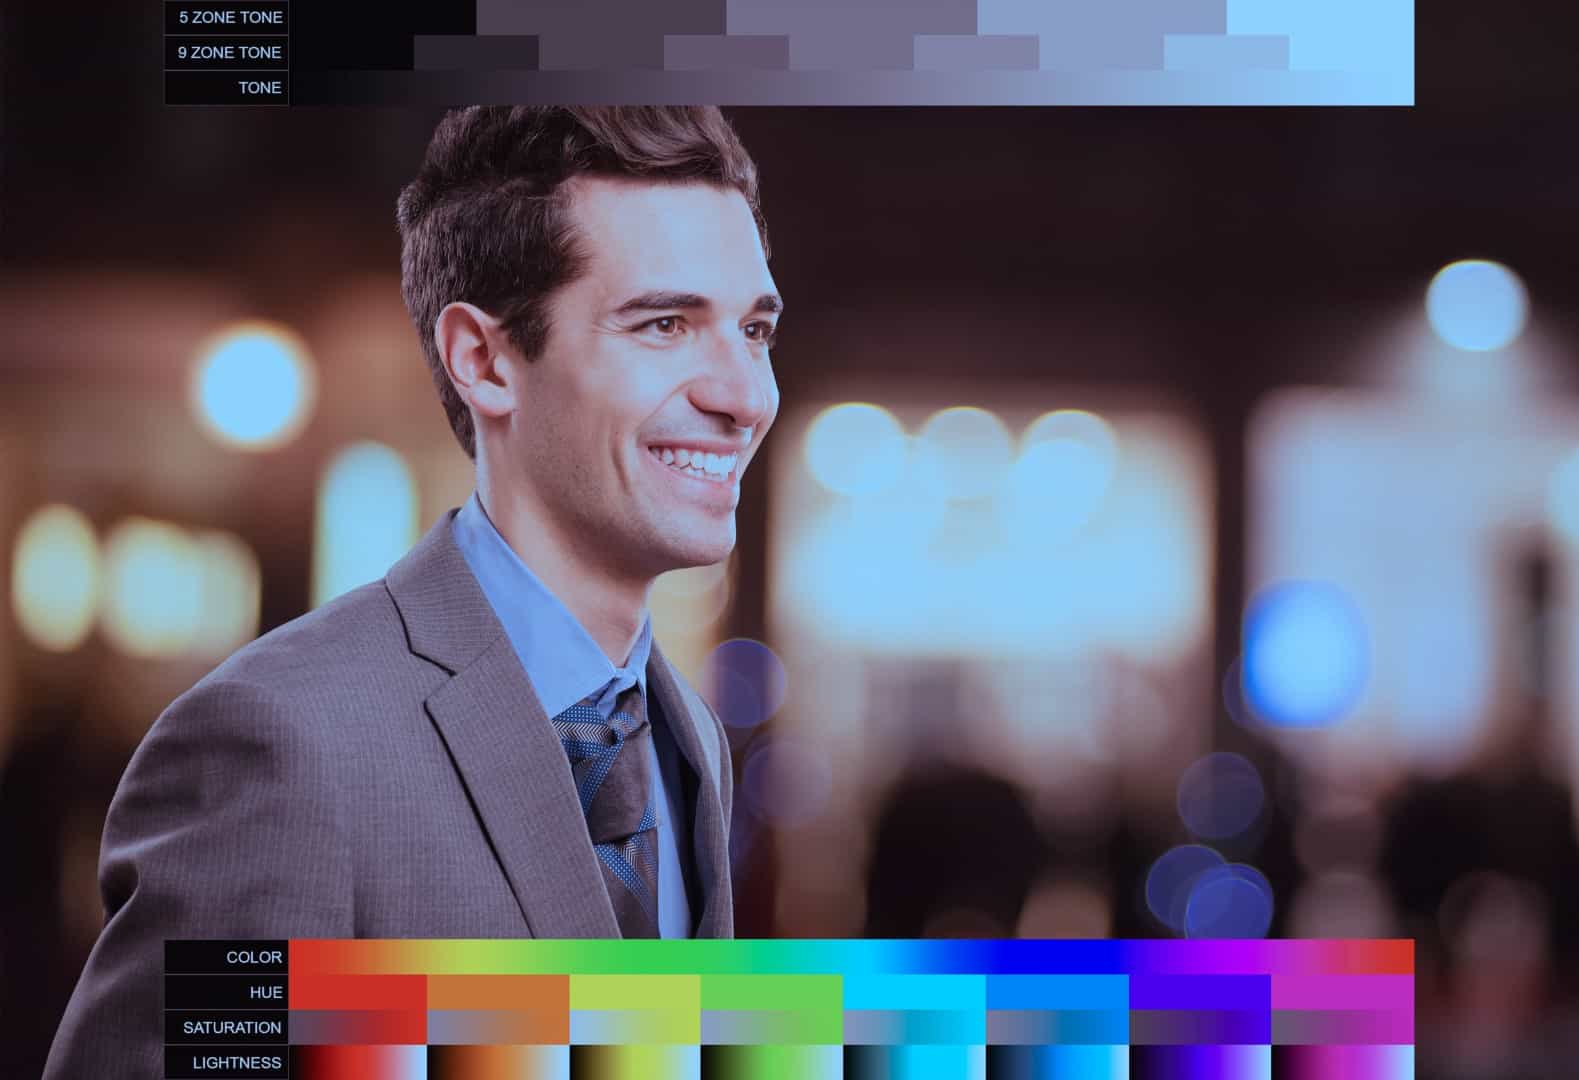
First I’m going to look at one of Wakui’s photos and try to replicate something similar or at least inspired by it. When analyzing effects, the first step is to look at the shadows and highlights. So we can see in this photo that the blacks have been lifted… so the darkest areas have been made brighter. And there’s also a slight blue-green tint. If we look at the streetlights, we can see that this has a yellow tint. So that’s something that we can keep in mind. On the buildings, we can see some reds. Now he might have used the Gradient Map in Photoshop for this, but you can get something very similar with just the tone curves. So I’m looking here and I’m guessing that this red color is in the the highlights.
Step 5
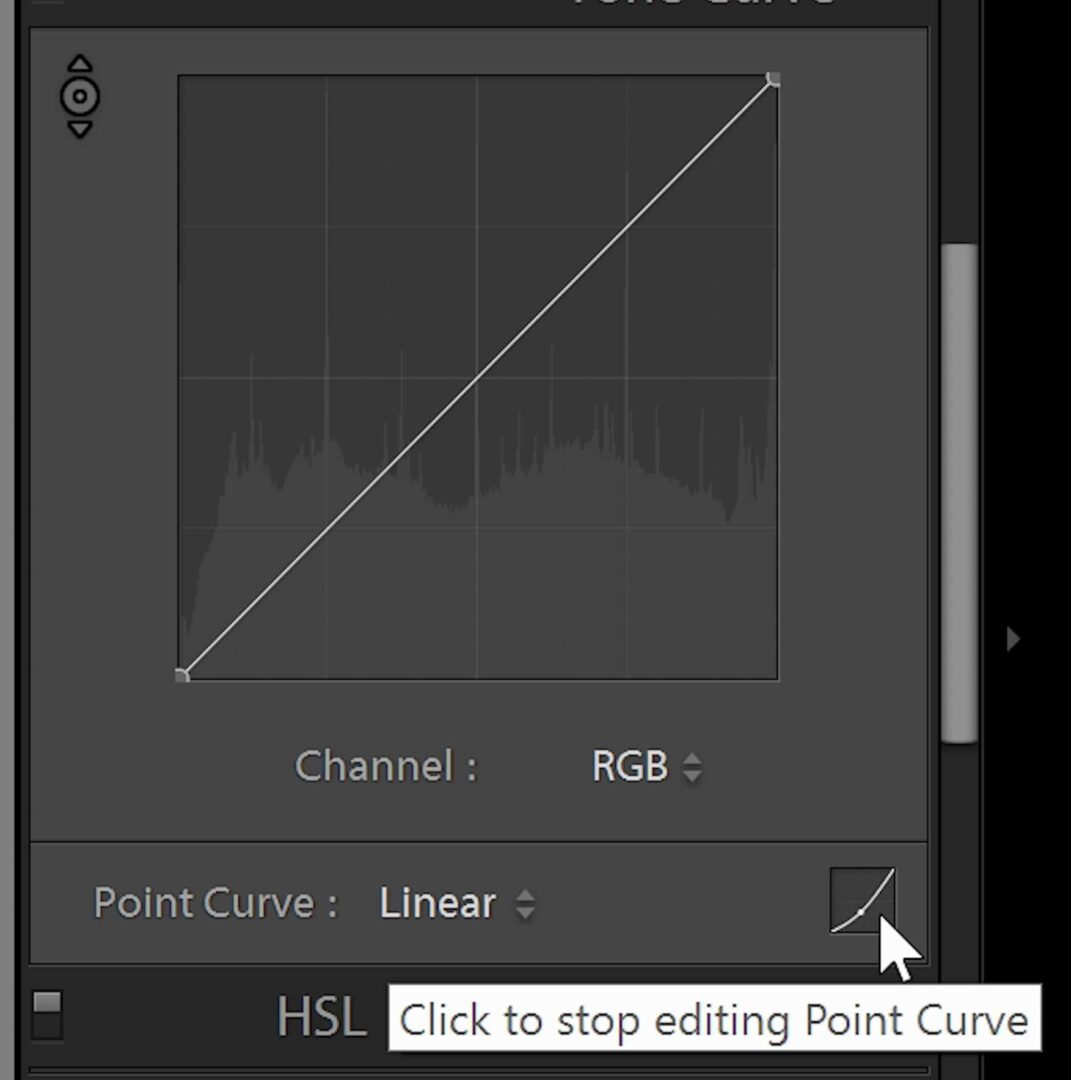
So now that we know what we want, let’s try recreating it in Lightroom. First go to your Tone Curve adjustment. There’s two tone curve mode in Lightroom. Simply put, one is for beginners and it restricts what you can do so that you don’t mess up your photo. The other is for advanced users and it gives you way more flexibility and that’s the one we’re going to use. If you don’t see it, you can click on this button here to switch between the two mode.
Step 6
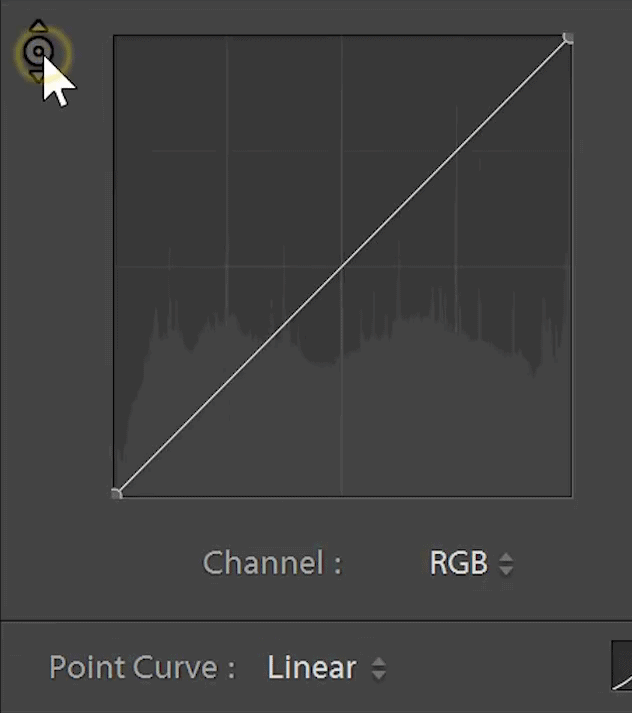
Don’t be scared by this tone curve. It’s quite easy when you use the tone chart. So start by selecting this Targeted Adjustment Tool. This tool lets you point anywhere in your image to create a point.
But instead of clicking on the image, we’re going to click on the chart and drag vertically to adjust the values.
Step 7
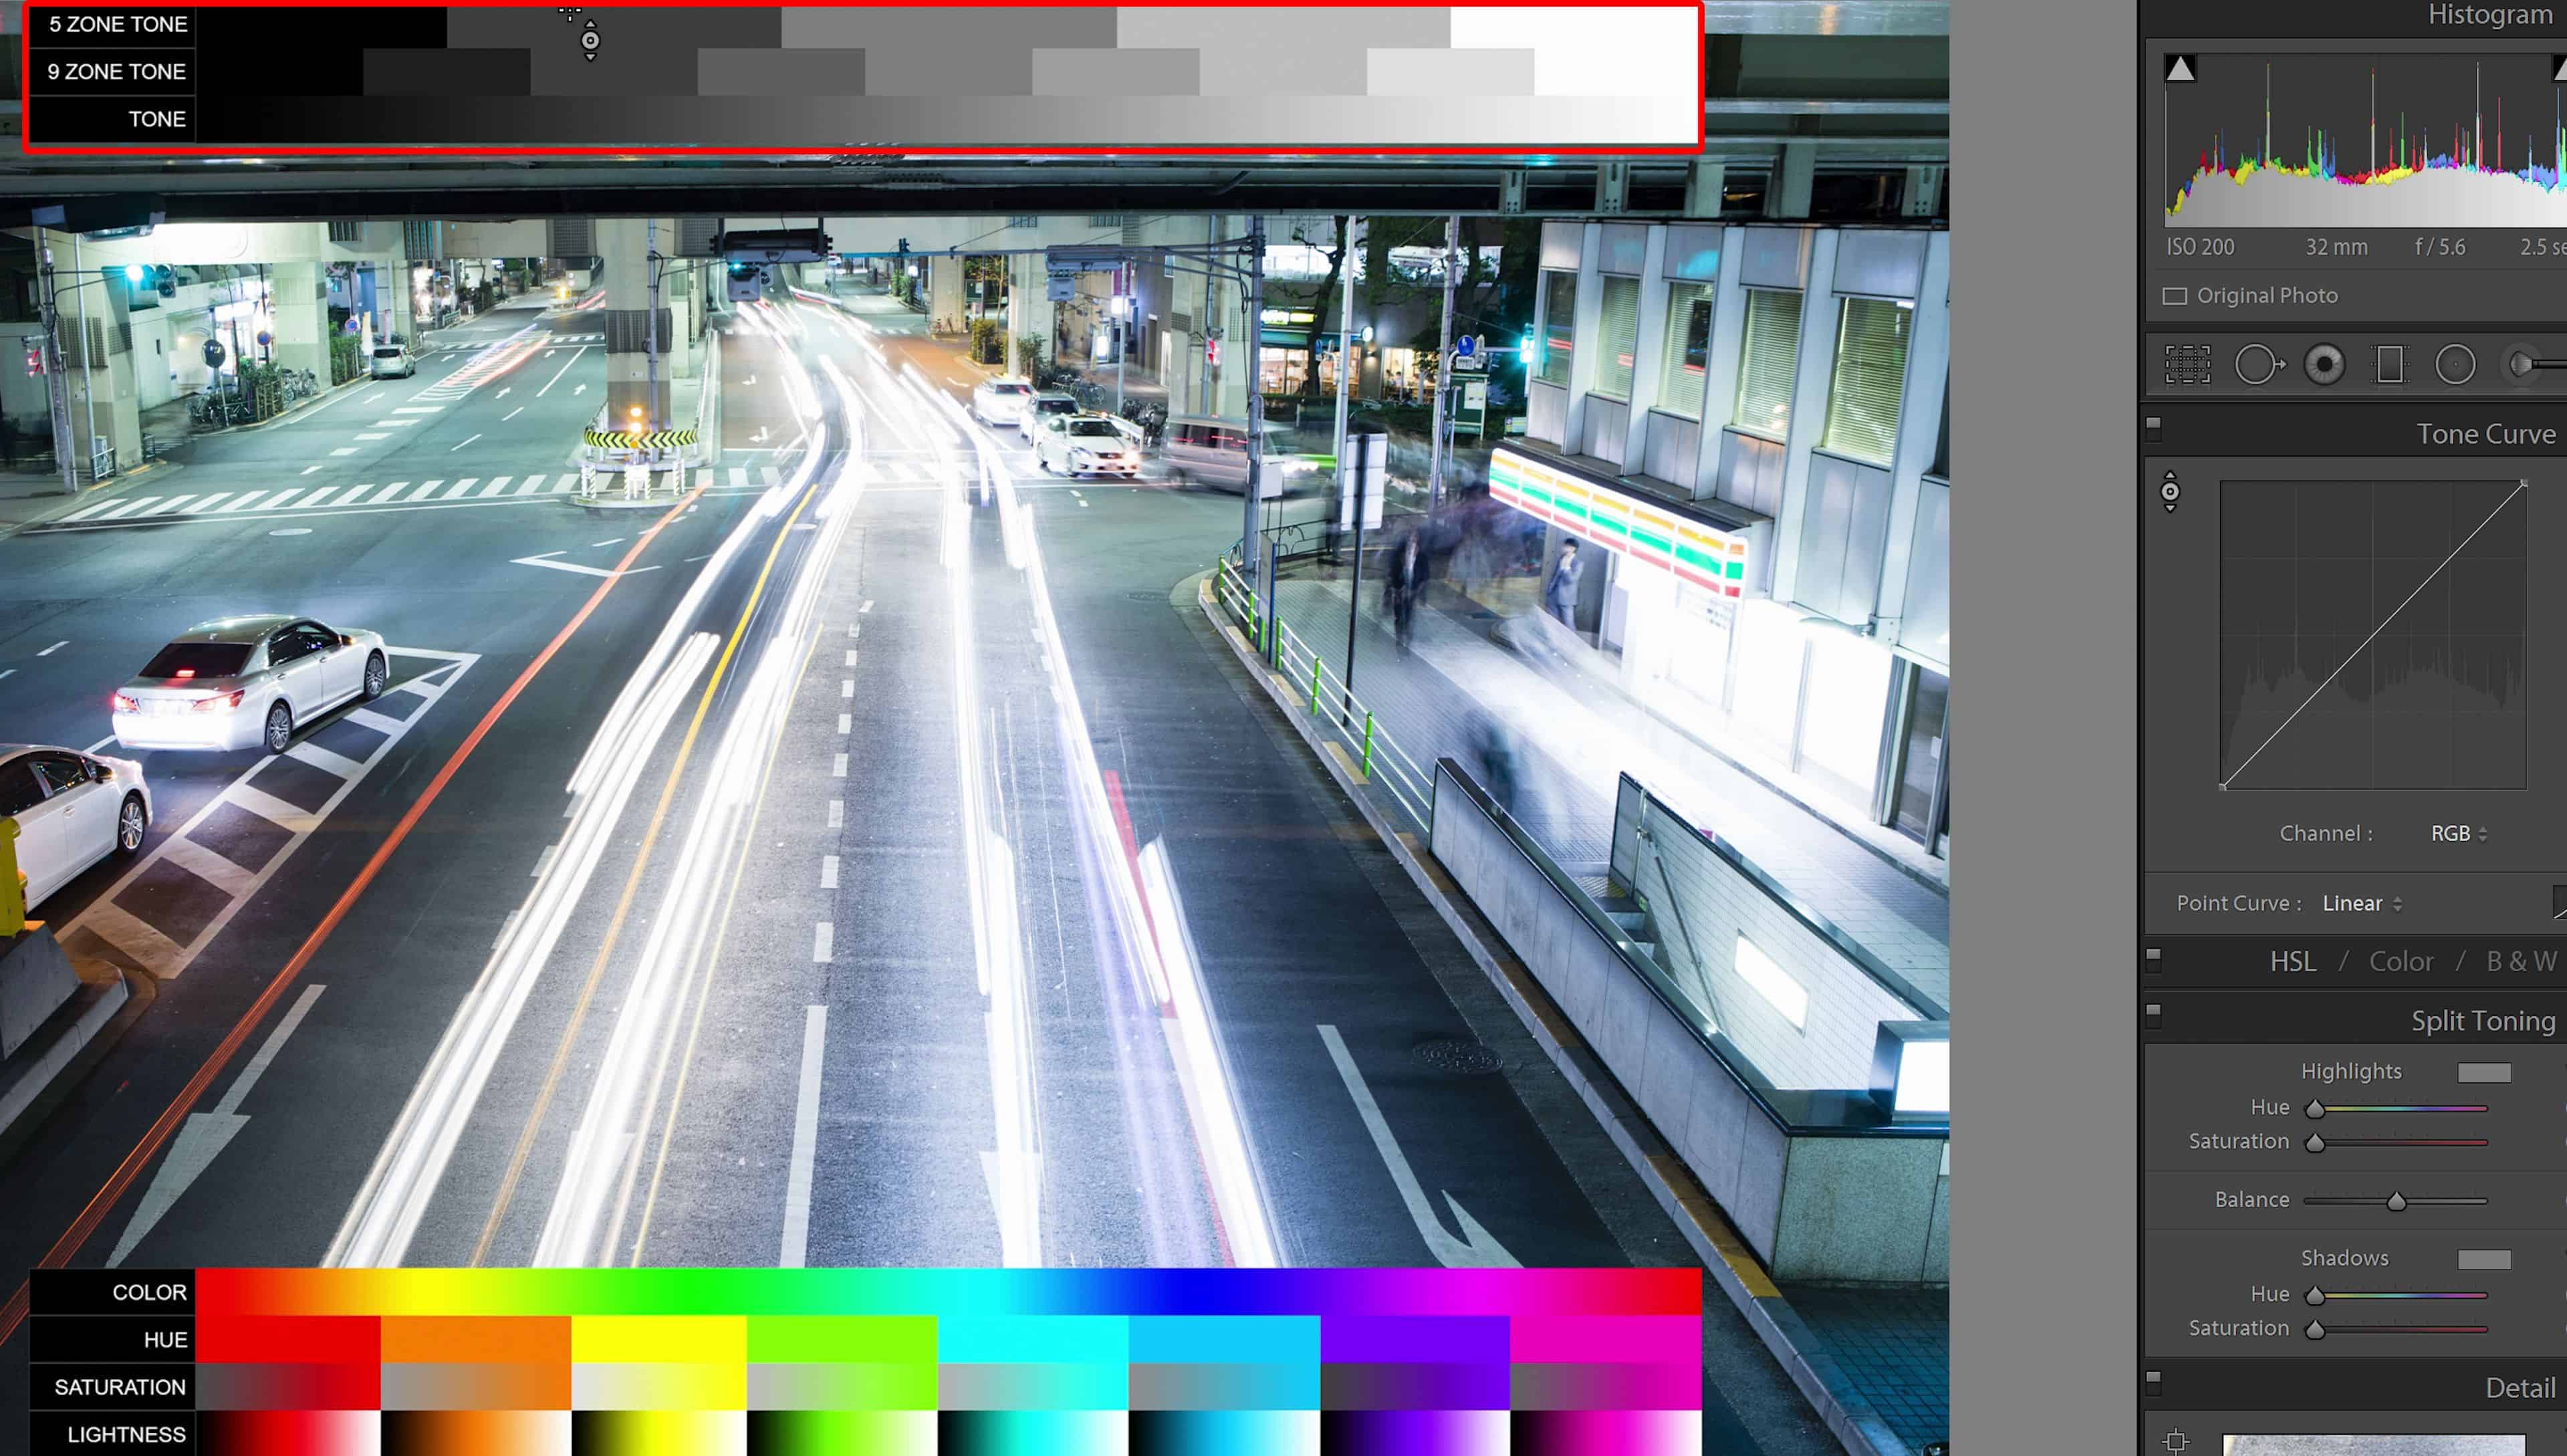
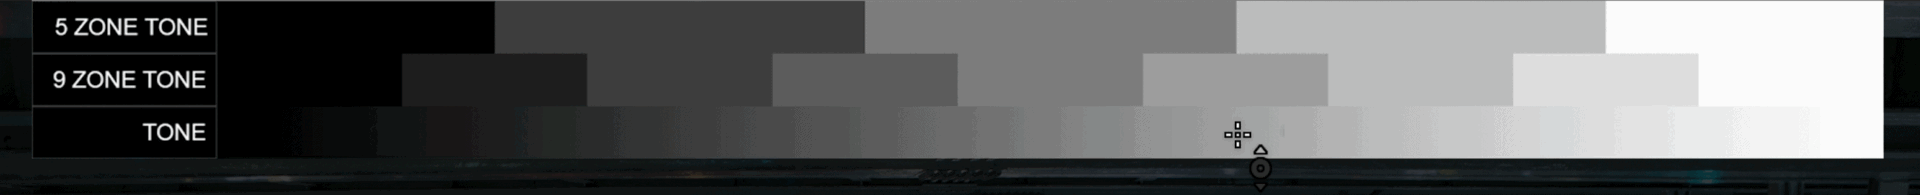
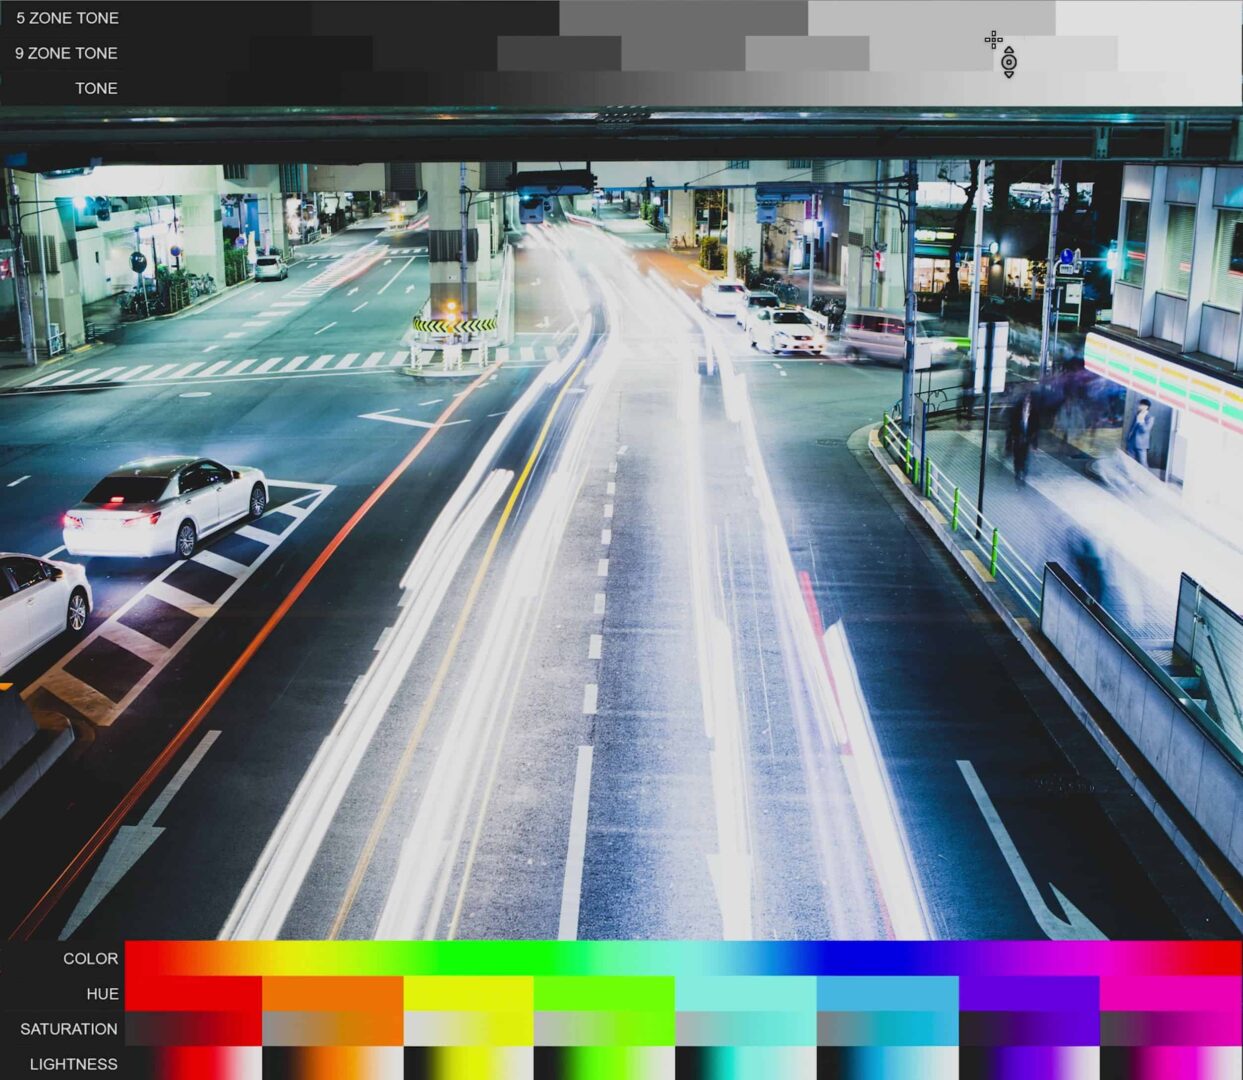
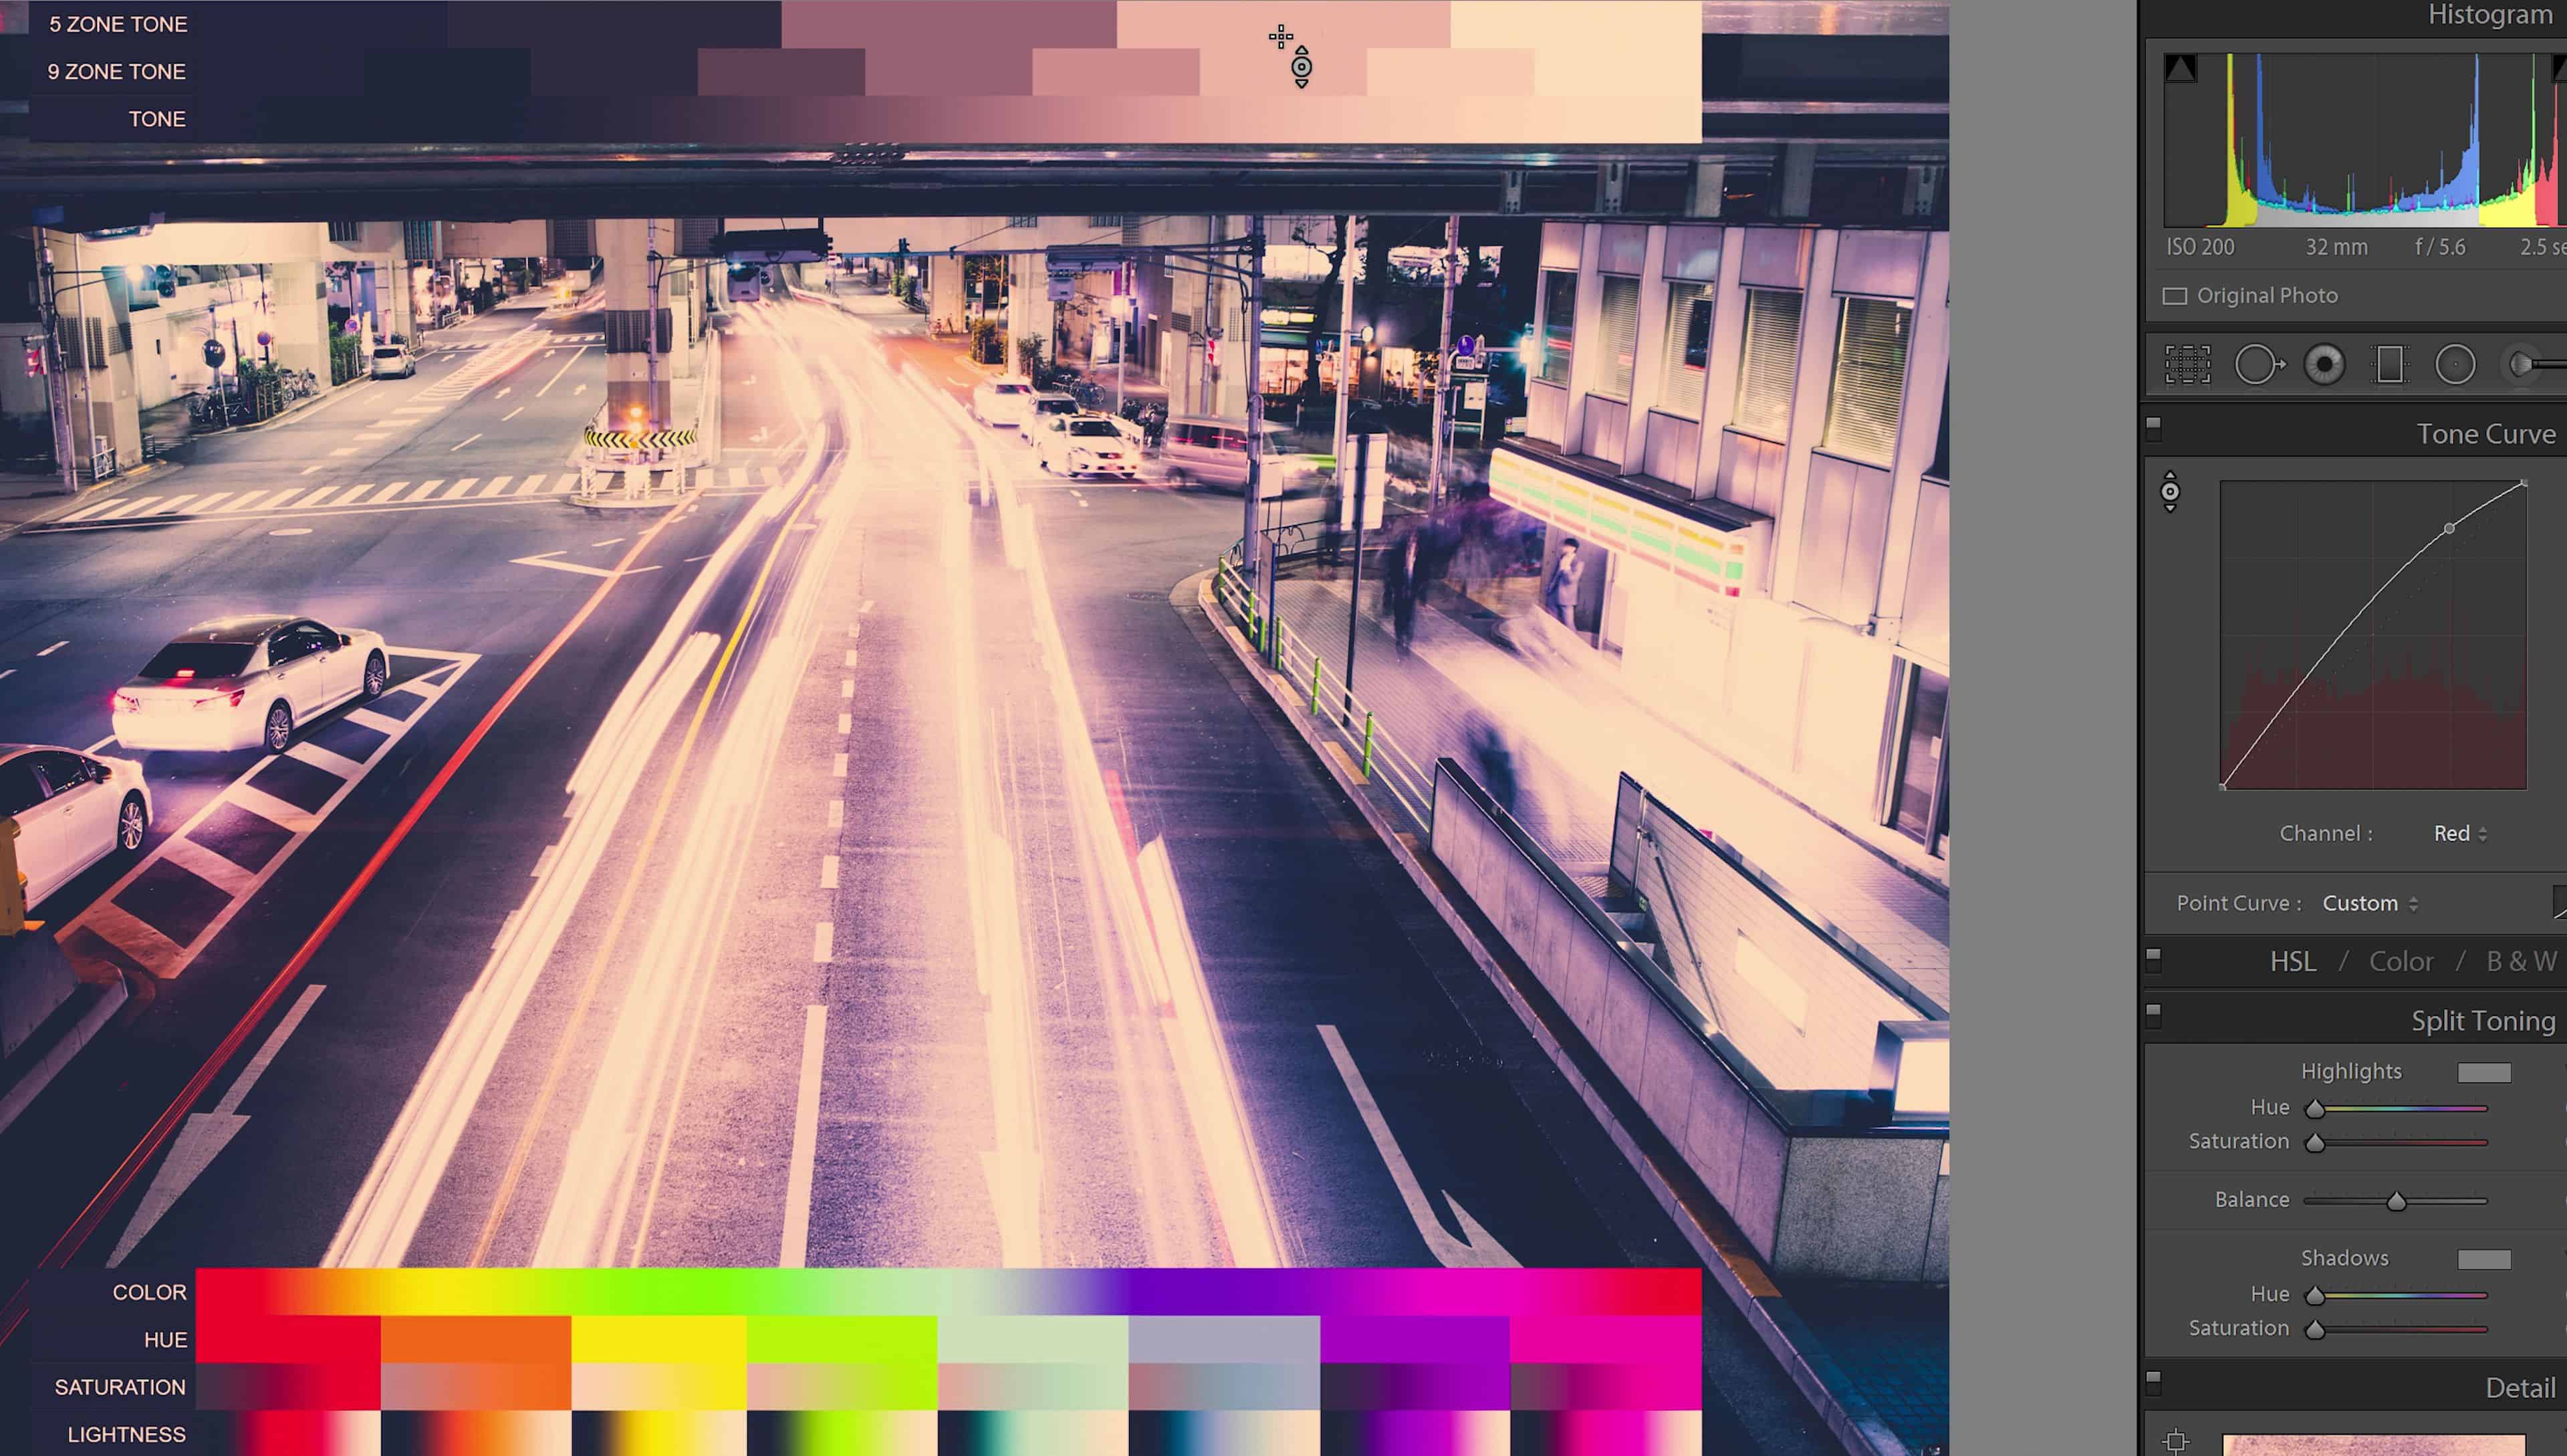
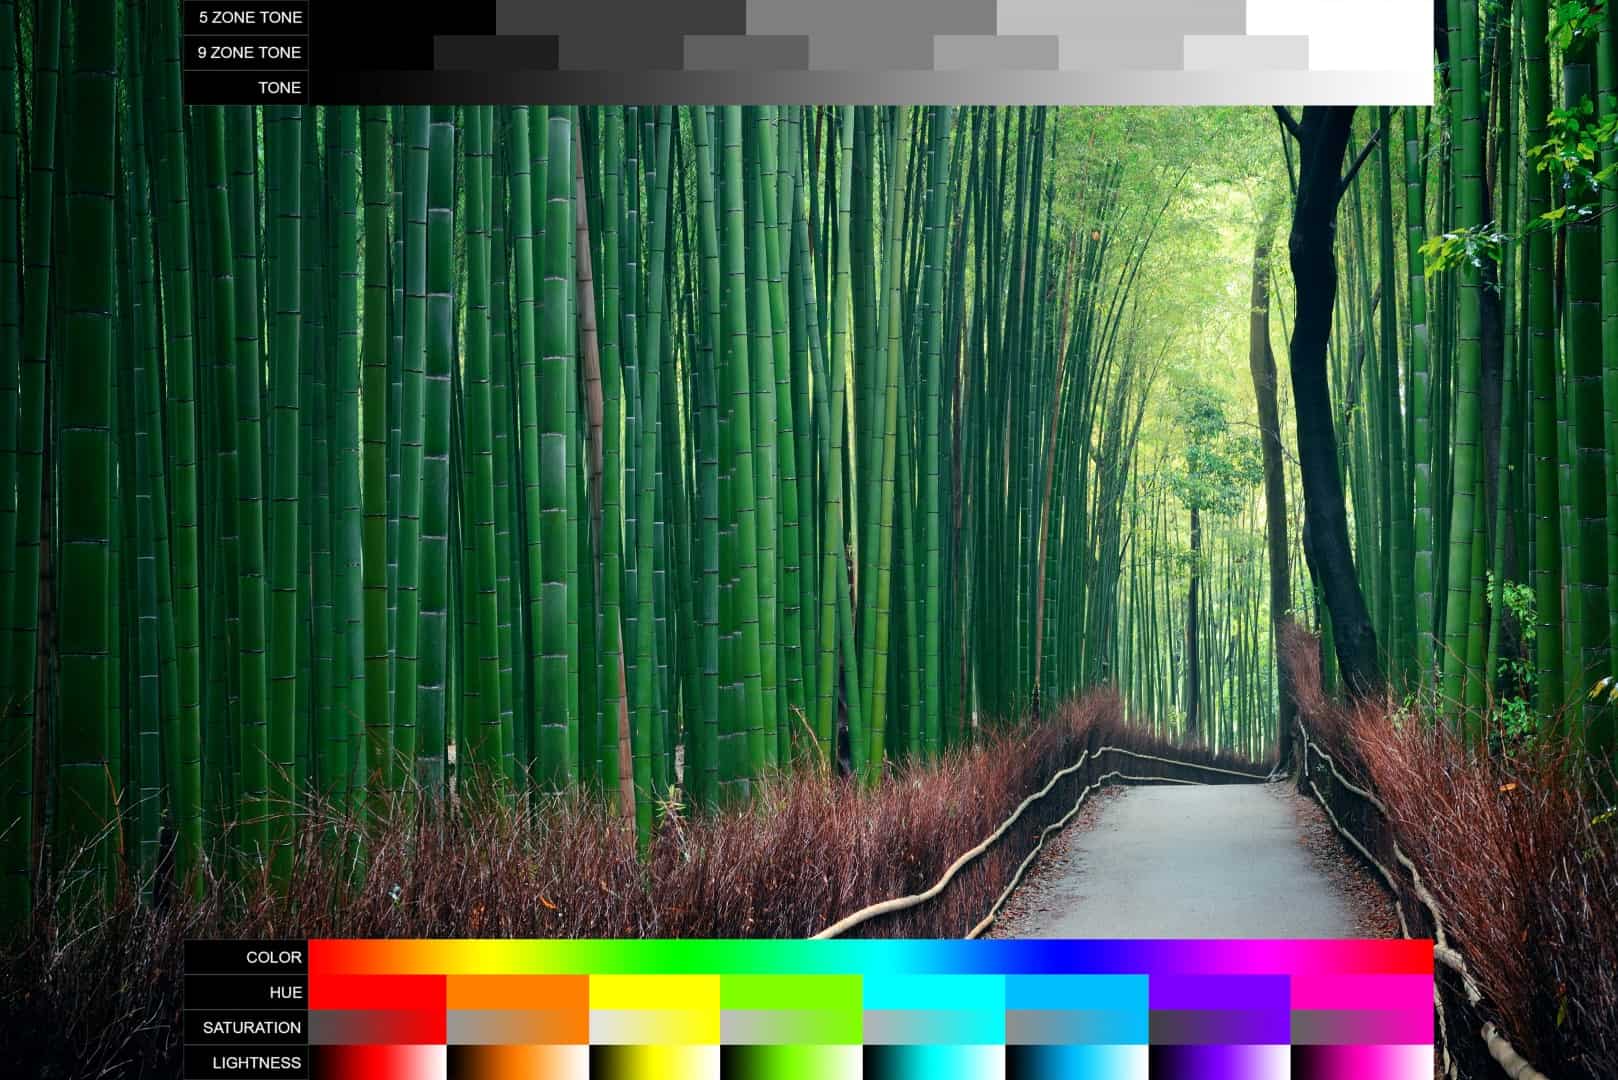
You’ll notice that there’s three rows in the tone chart. The top row is the 5 zone chart which gives you the blacks, shadows, midtones, highlights and whites.
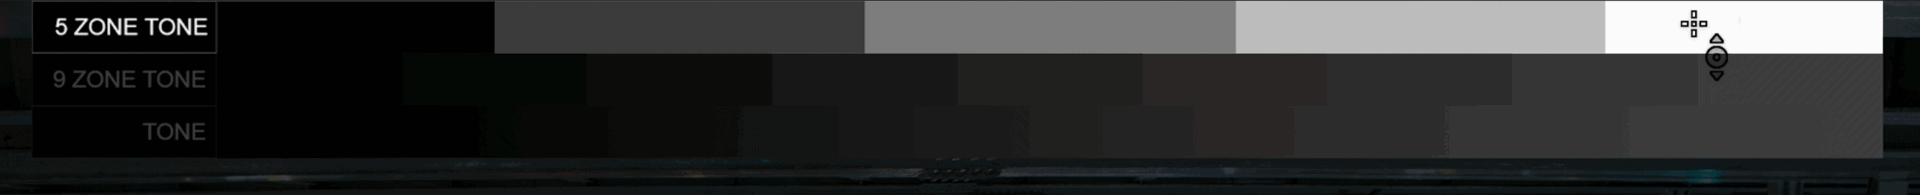
The second row gives you finder controls in case you need to target a more specific tonal area.
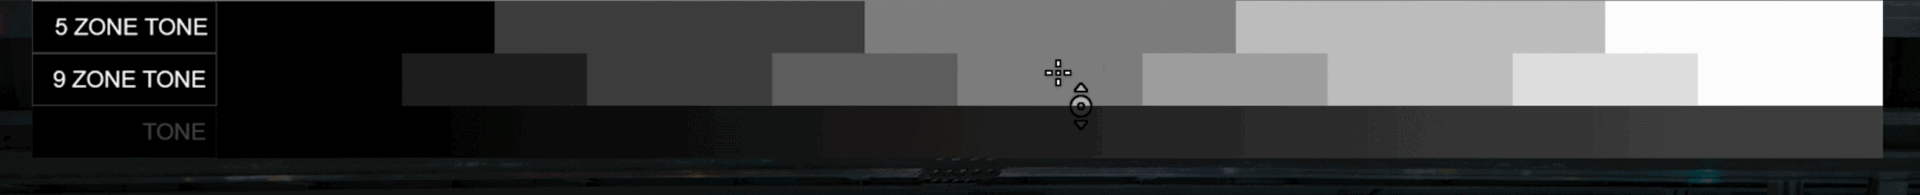
The bottom row is actually for visualization only so that you can see the effect you’re creating and ensure that your results are smooth and gradual – I’ll tell you more about this later.
Step 8
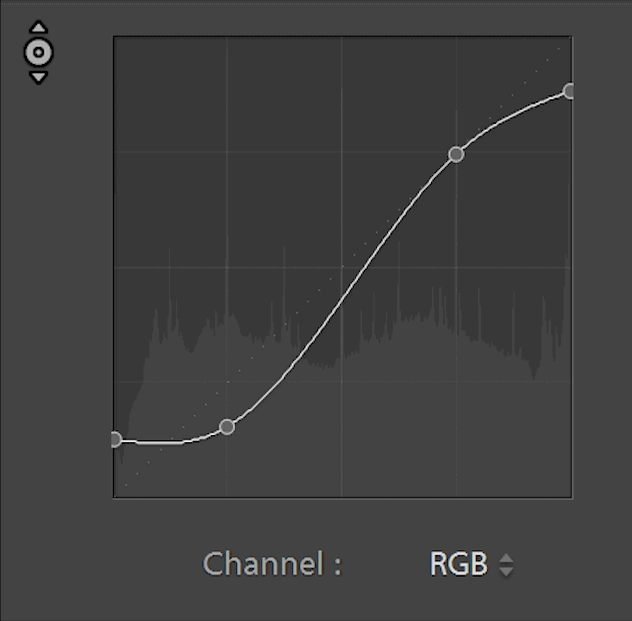
First, let’s create the faded look by lifting the blacks and then dropping the whites.
I’m also going to play around with the other three zones to get the tones closer to the look I’m going for.
When you’re done, you’ll get a tone curve like this. It’s clean and simple.
Step 9
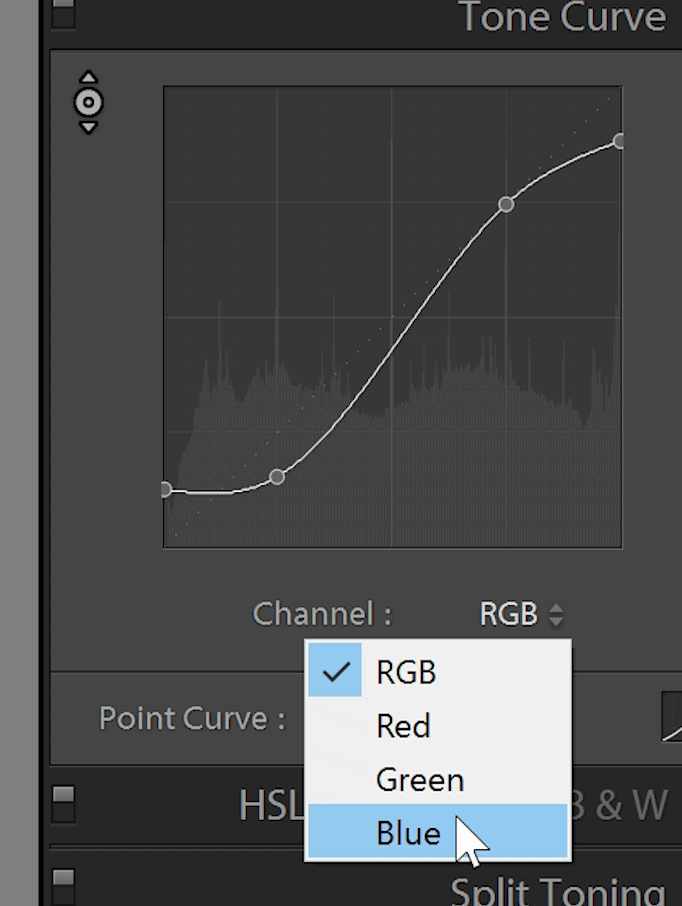
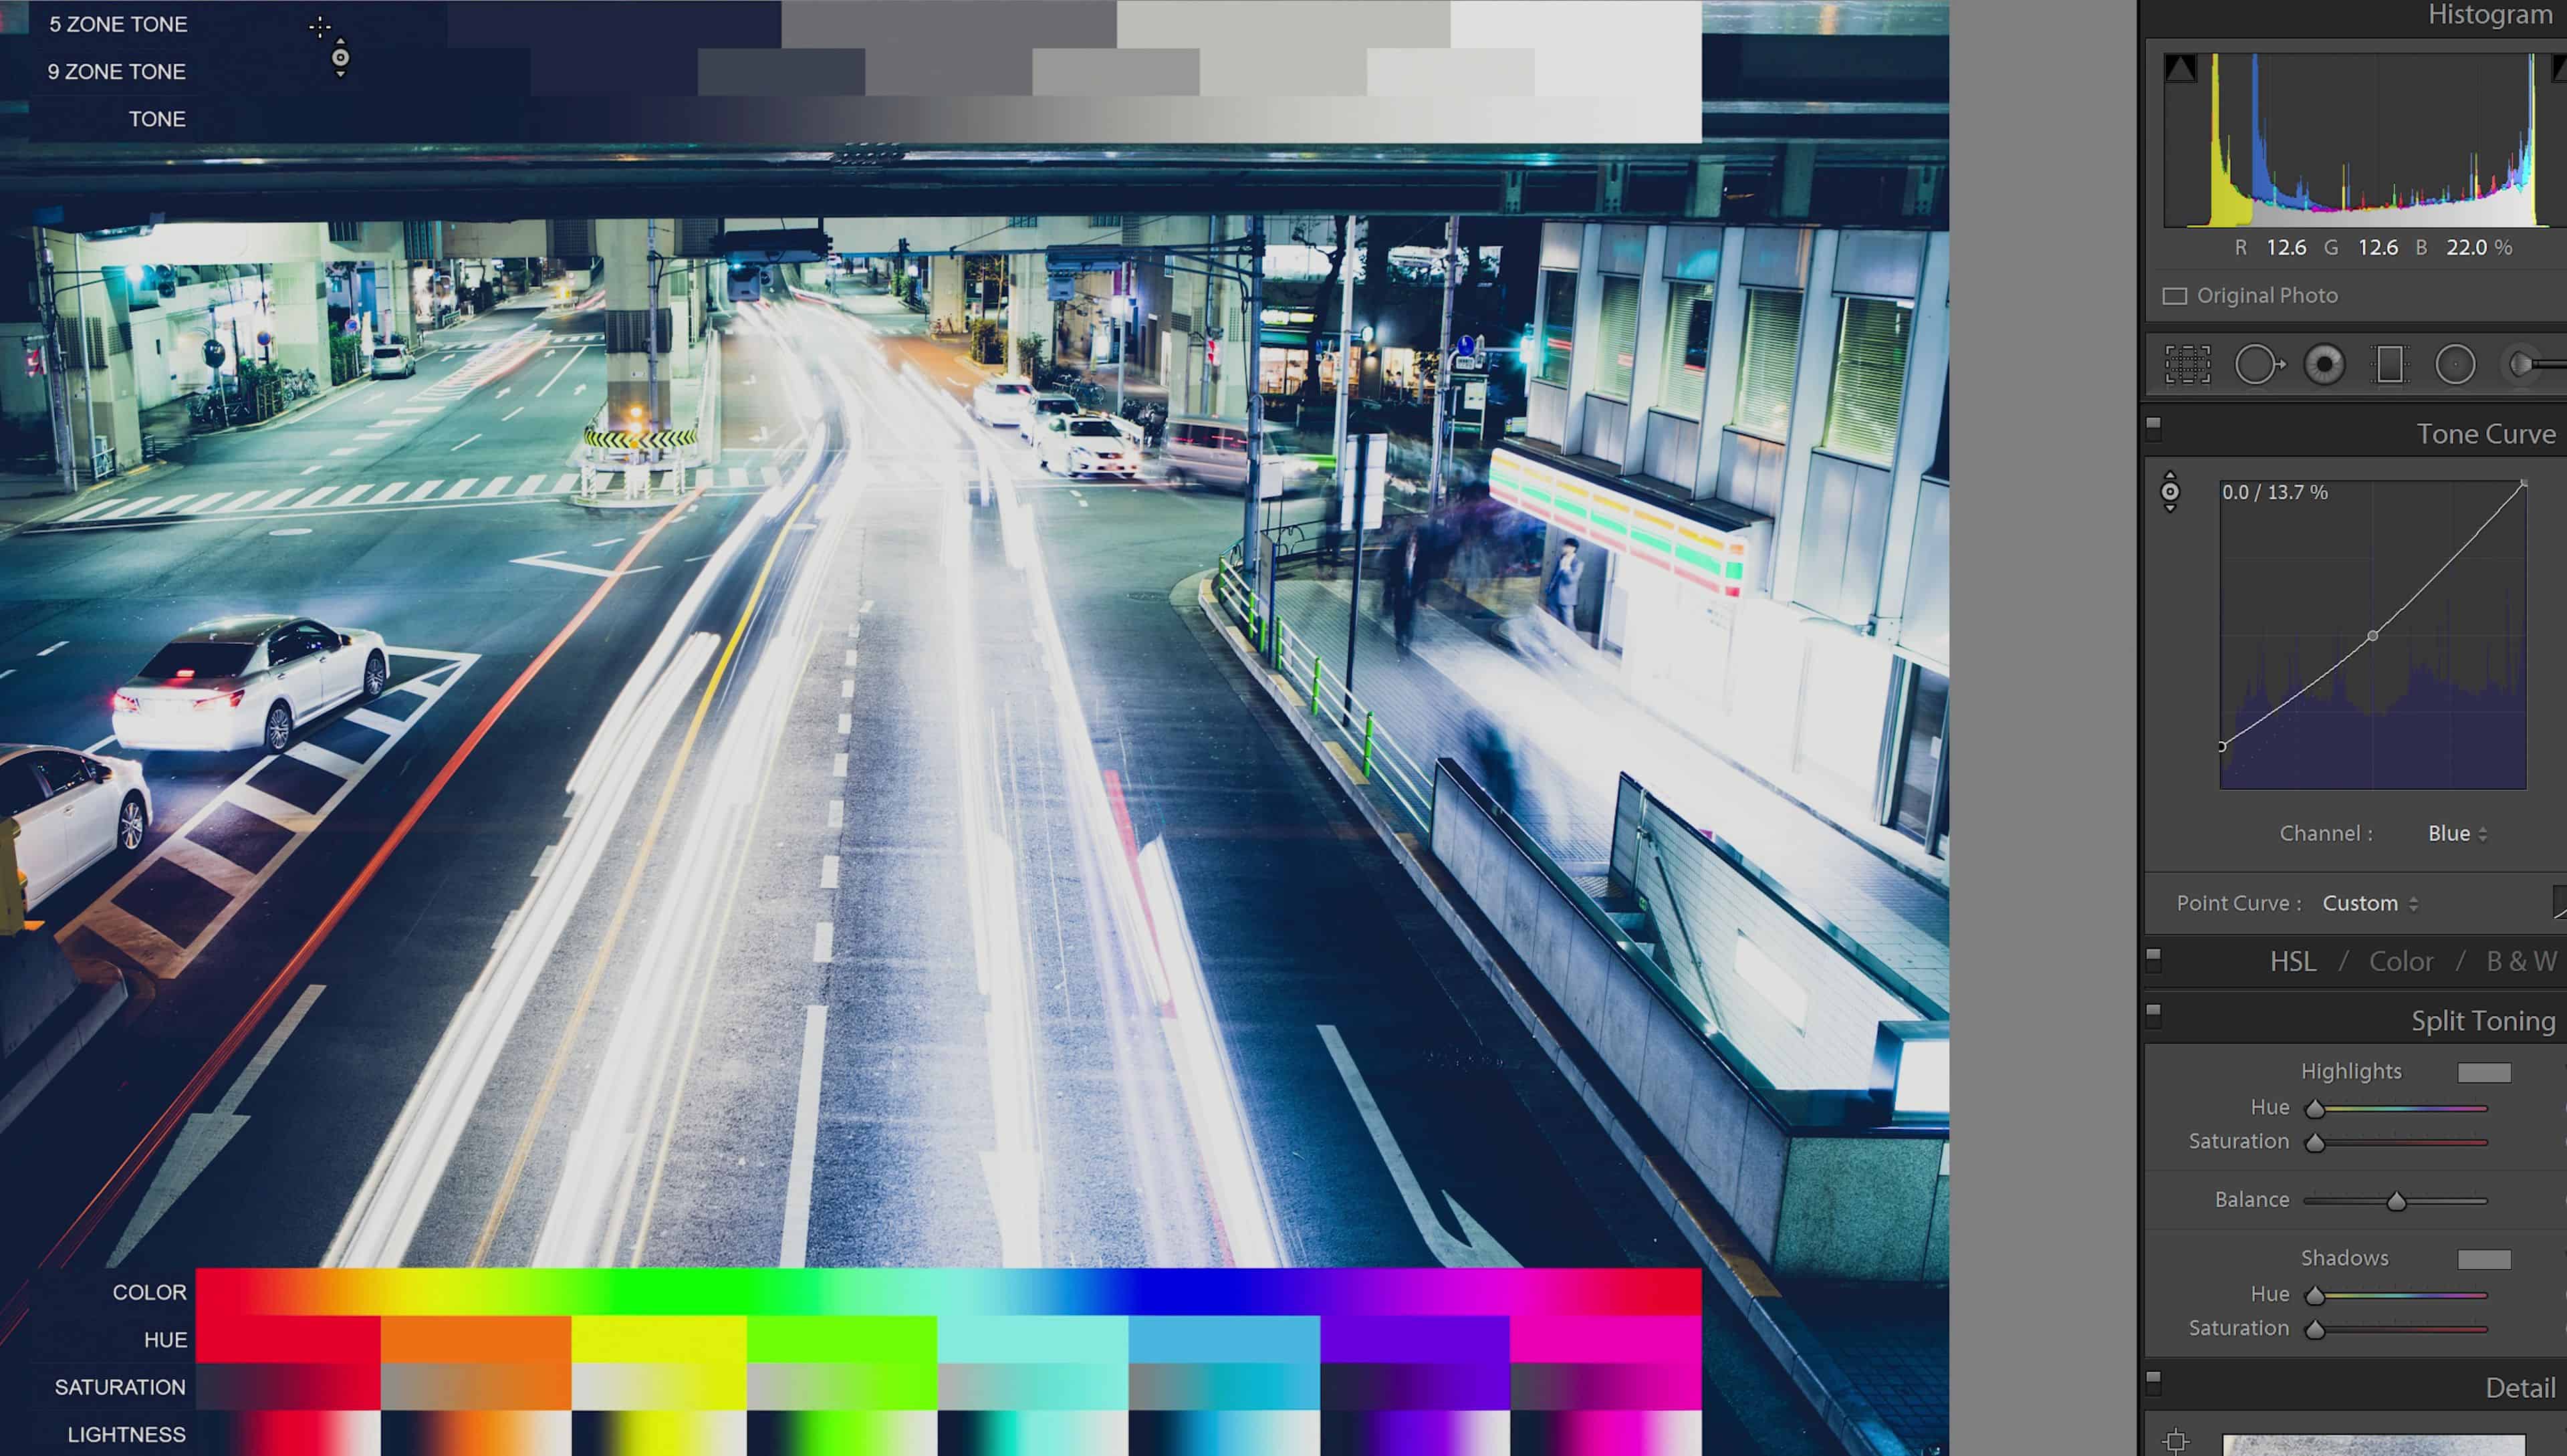
Next, we’re going to start using the red, green and blue channel. This is the hardest part about the tone curve but using the chart makes it a lot easier.
So looking back at Masashi Wakui’s photo, let’s start by trying to replicate the blue-green shadows.
In the Tone Curves, I’m going to switch to the blue channel and lift up the shadows. Then I’m going to drop back the midtones so that the blue is only showing in the shadows.

Step 10
Next, I’m going to switch to the green channel and do the same thing trying to get a similar color. I’m just going to get something similar to Wakui’s photos instead of trying to get the exact effect.
Step 11
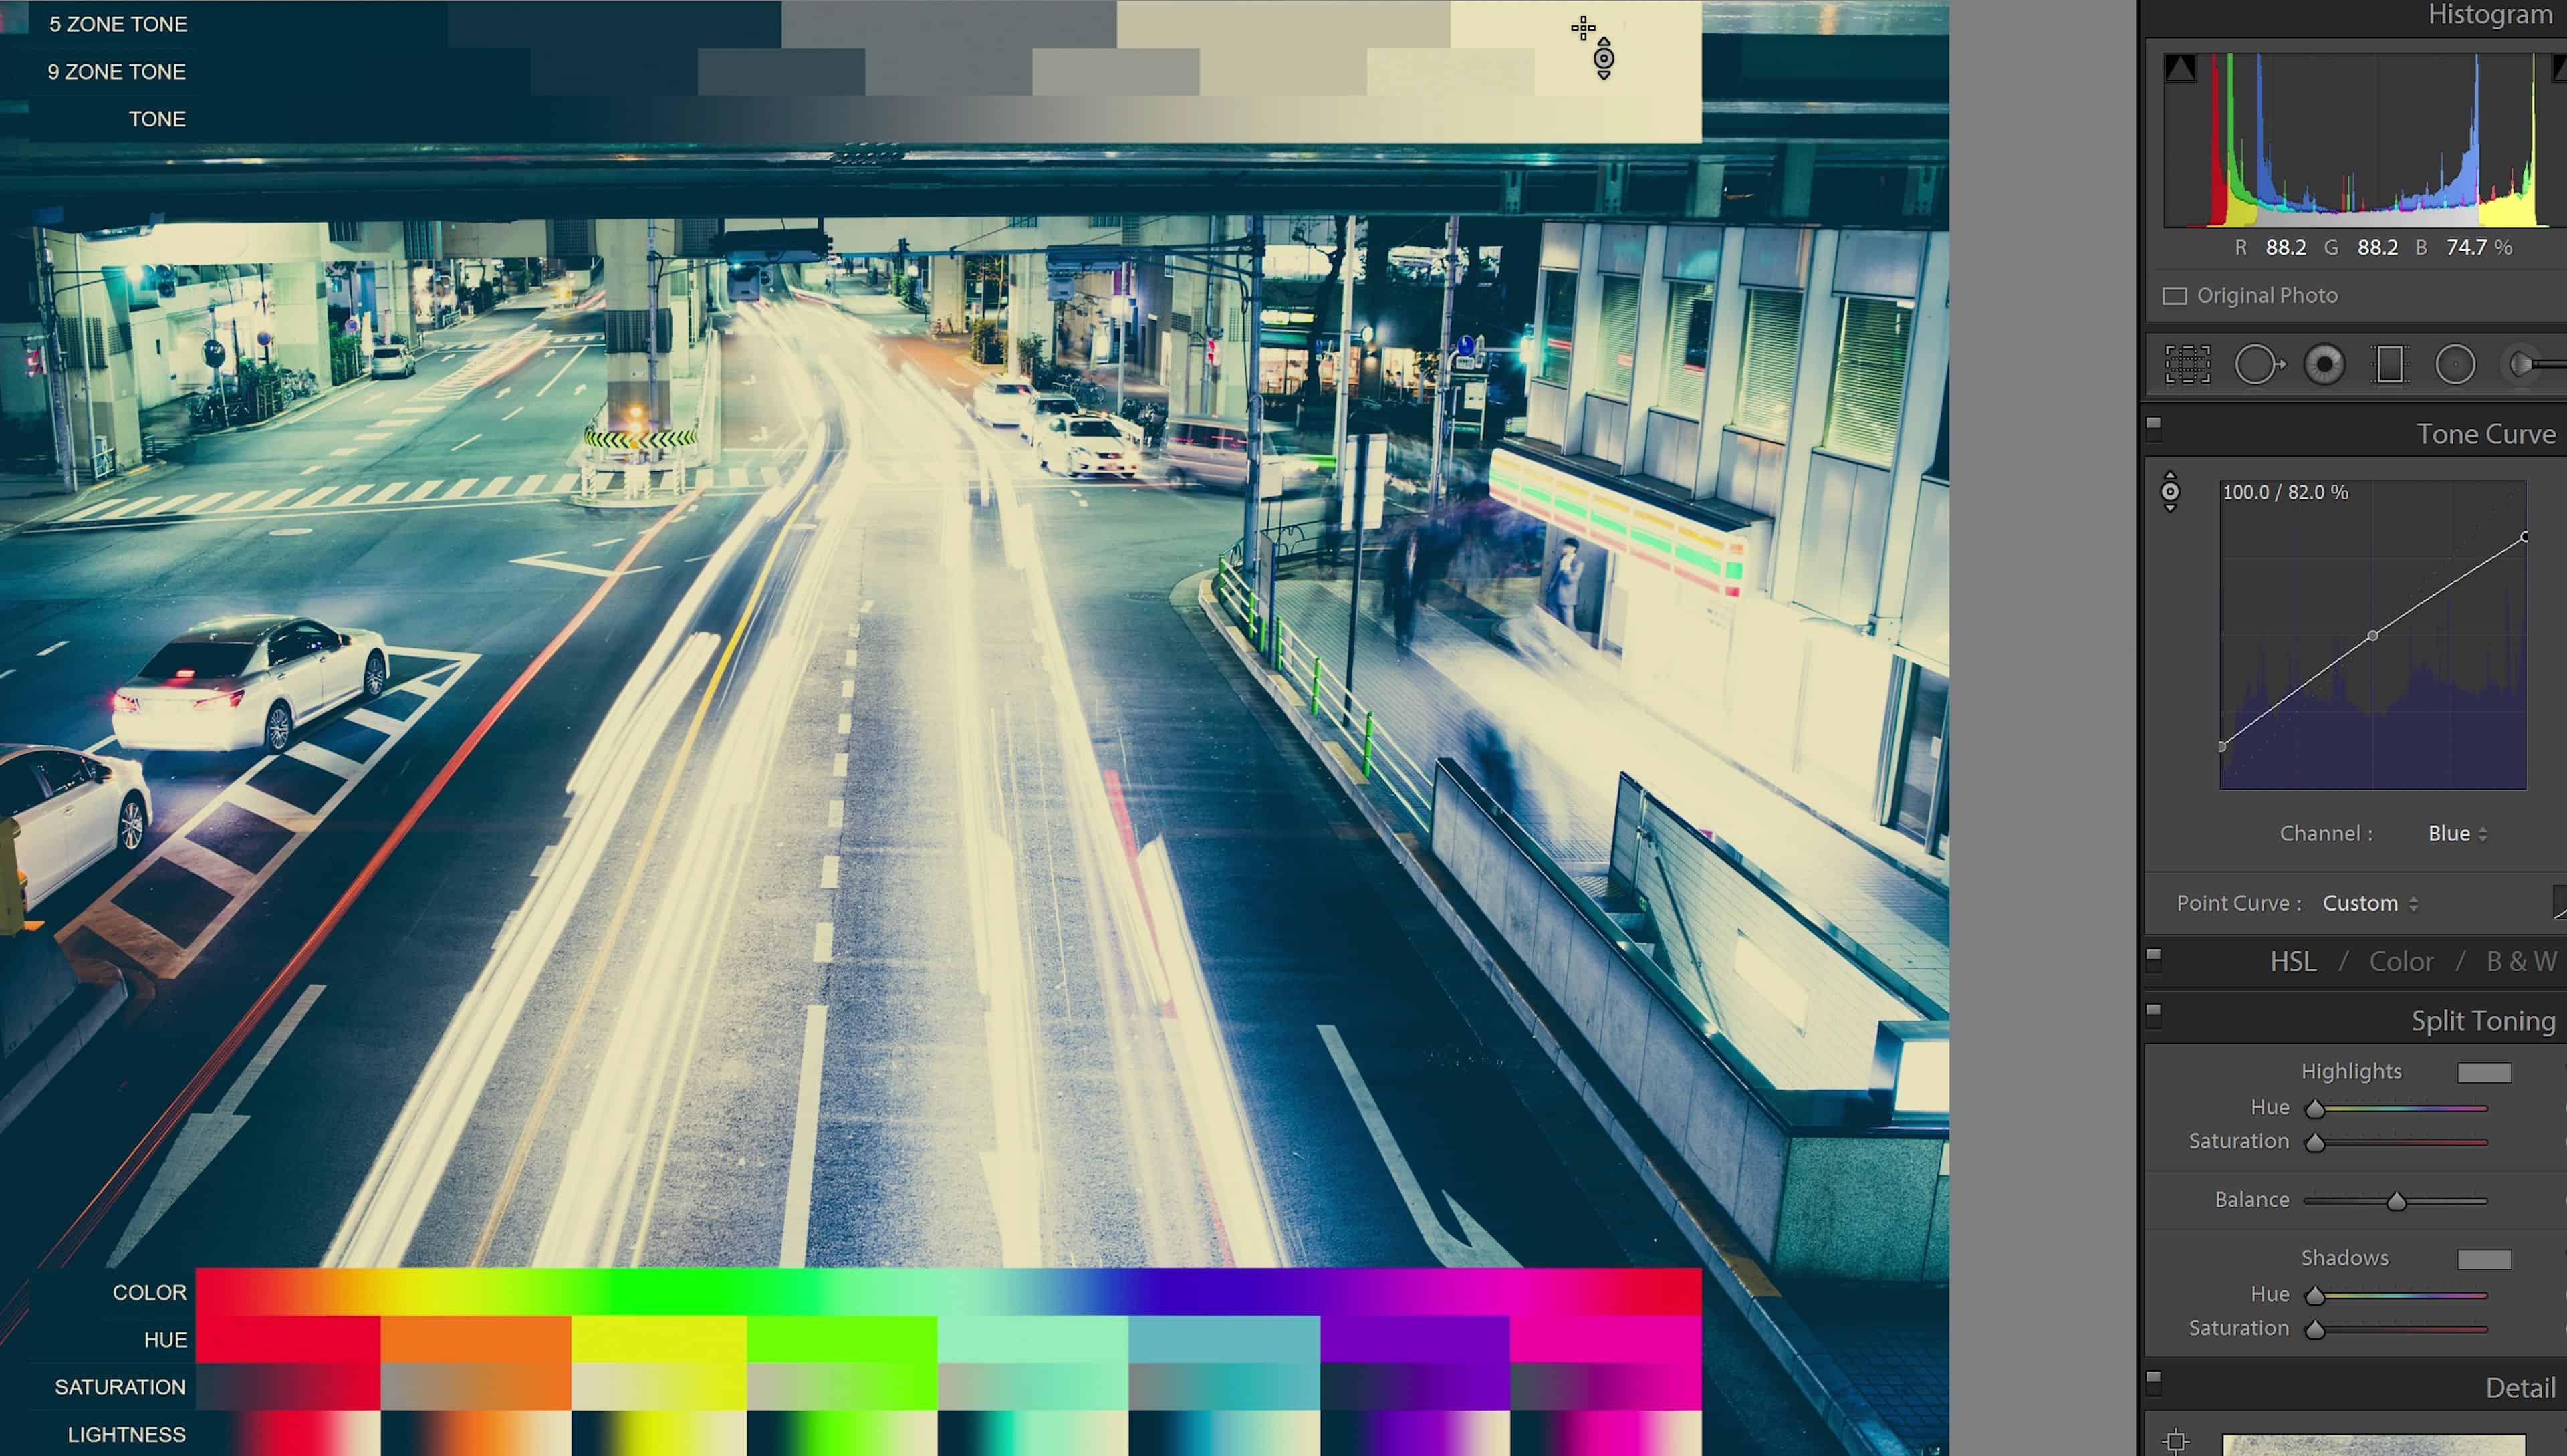
The next thing to do is to add the yellow tint in the whites. So for that, we’re going to switch to the blue channel. Yellow is the opposite color of blue so we can simply drag the whites down like this to reduce the blues which in effect creates the yellow tint.
Step 12
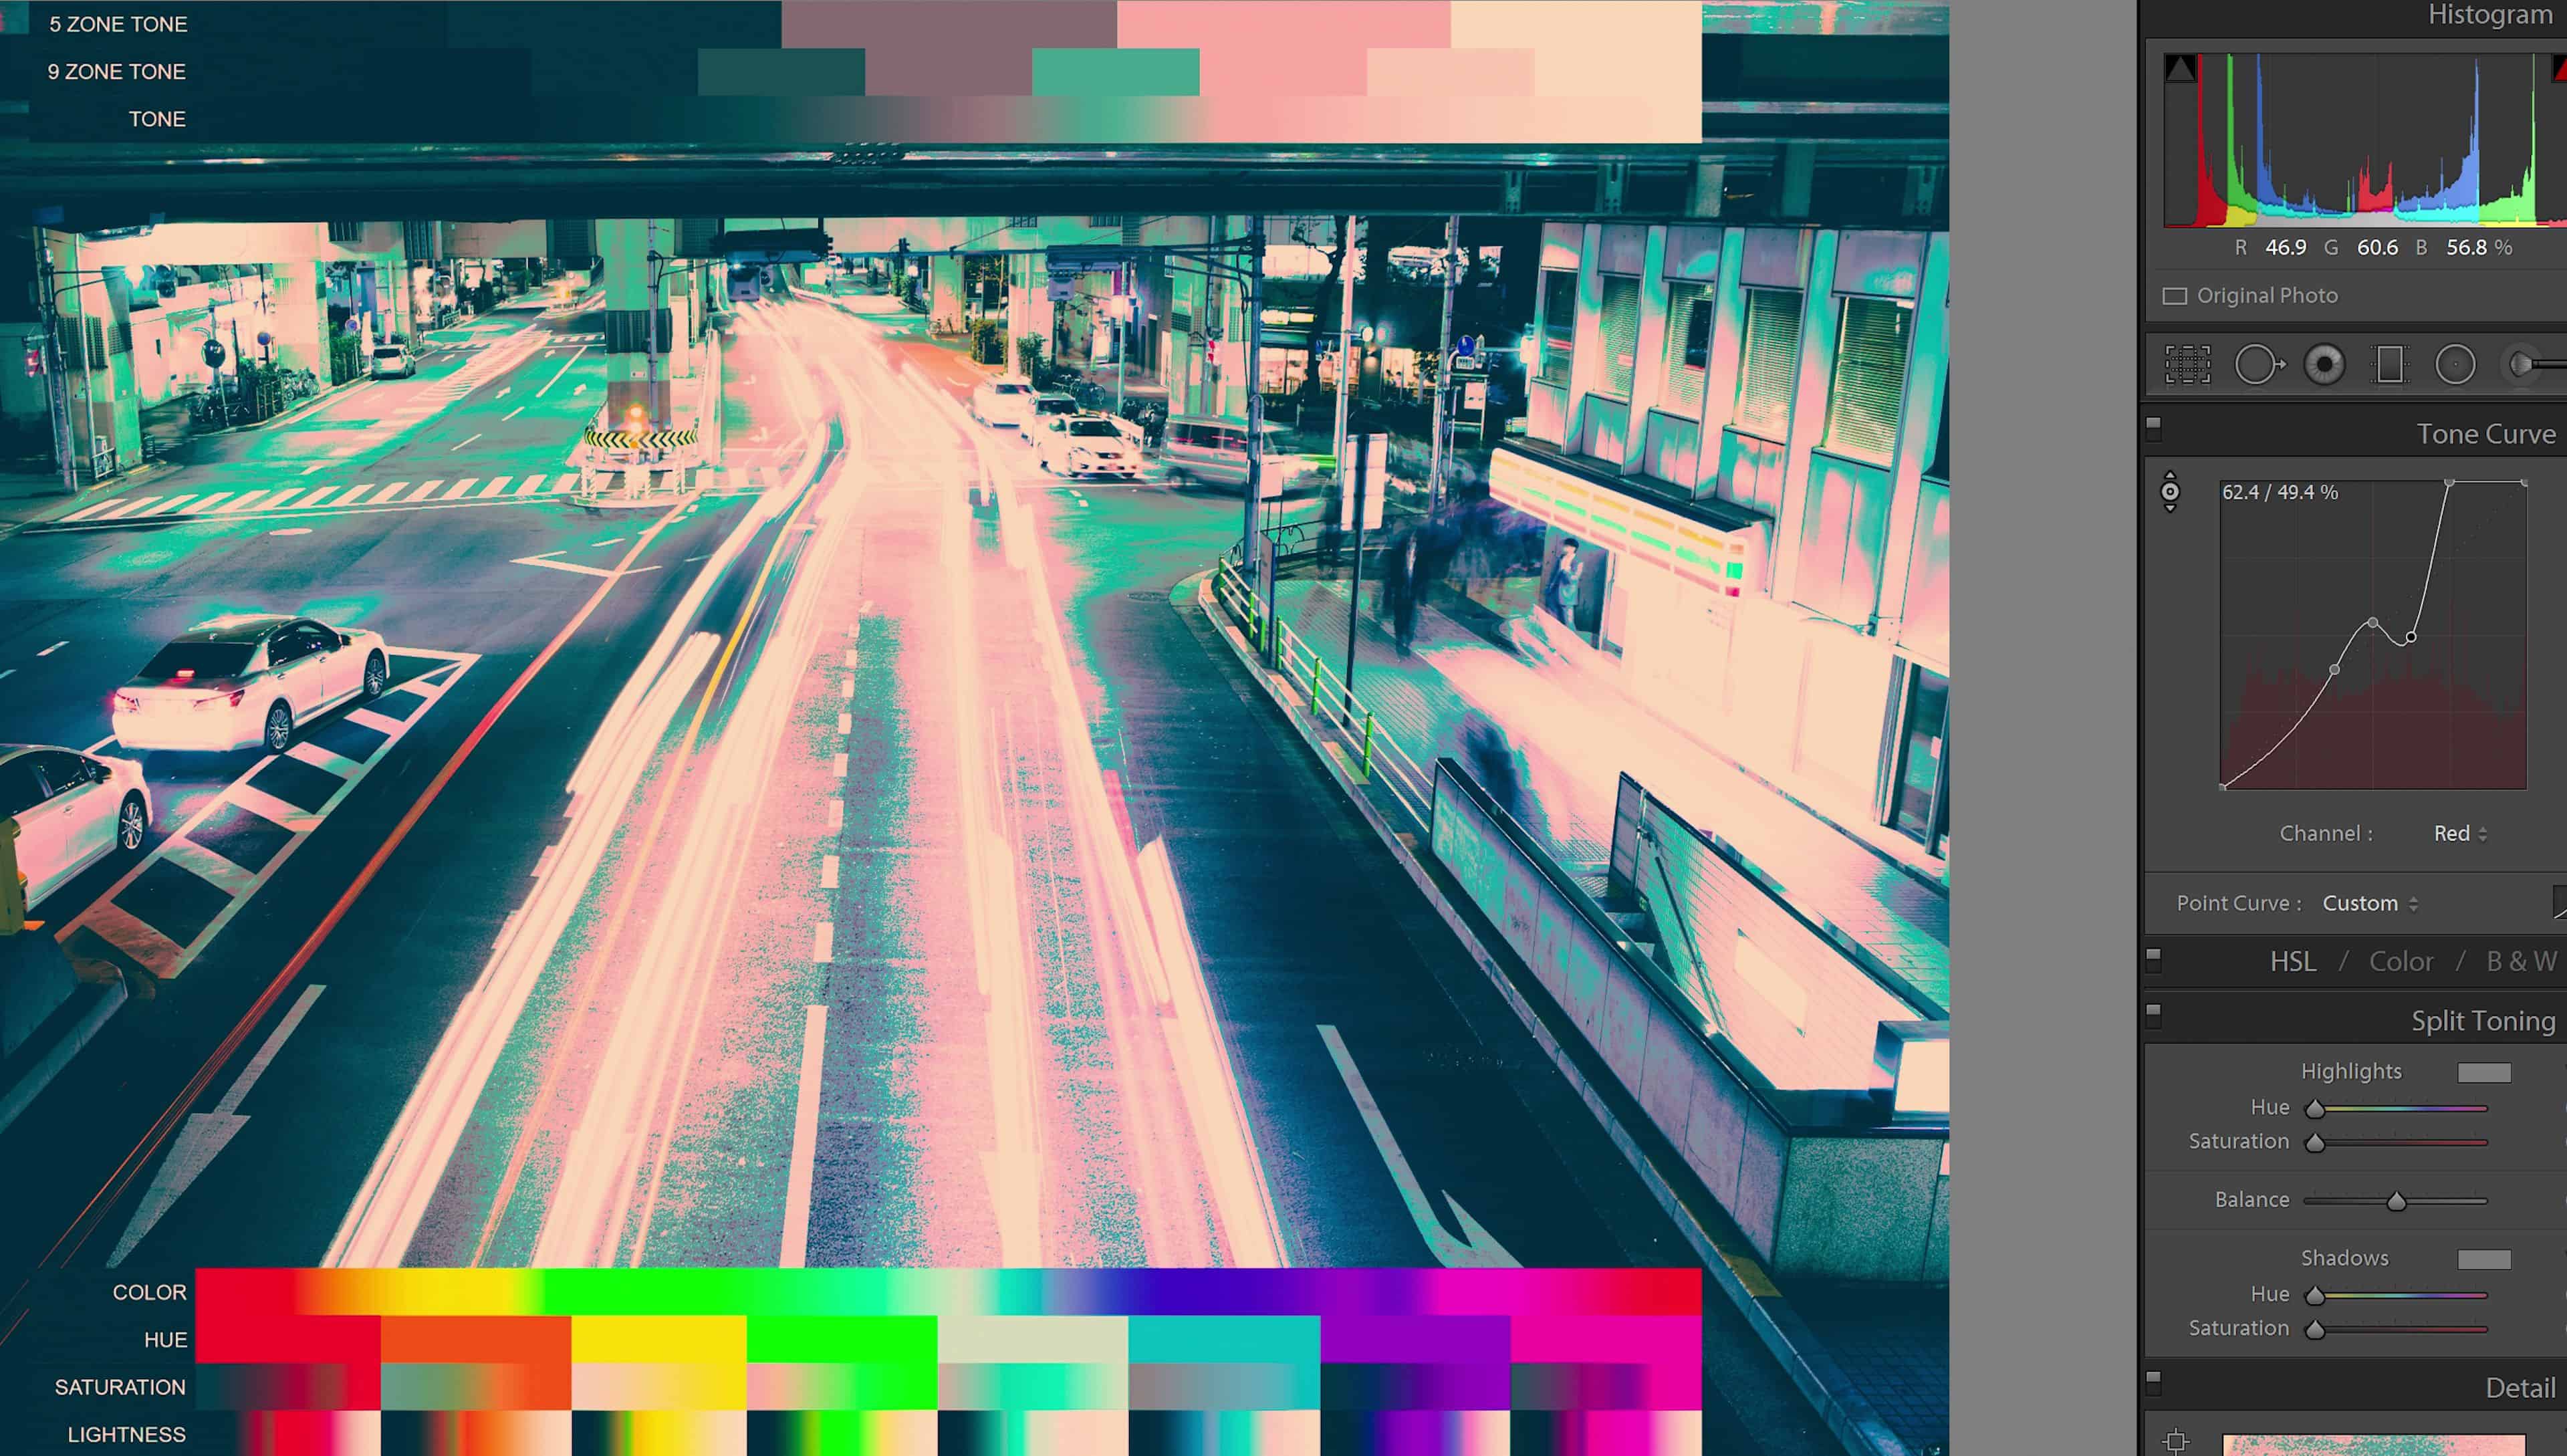
Finally, for the red tint in the photo, I’m going to switch to the red channel. I think it’s around this range so I’m going to lift the whites.
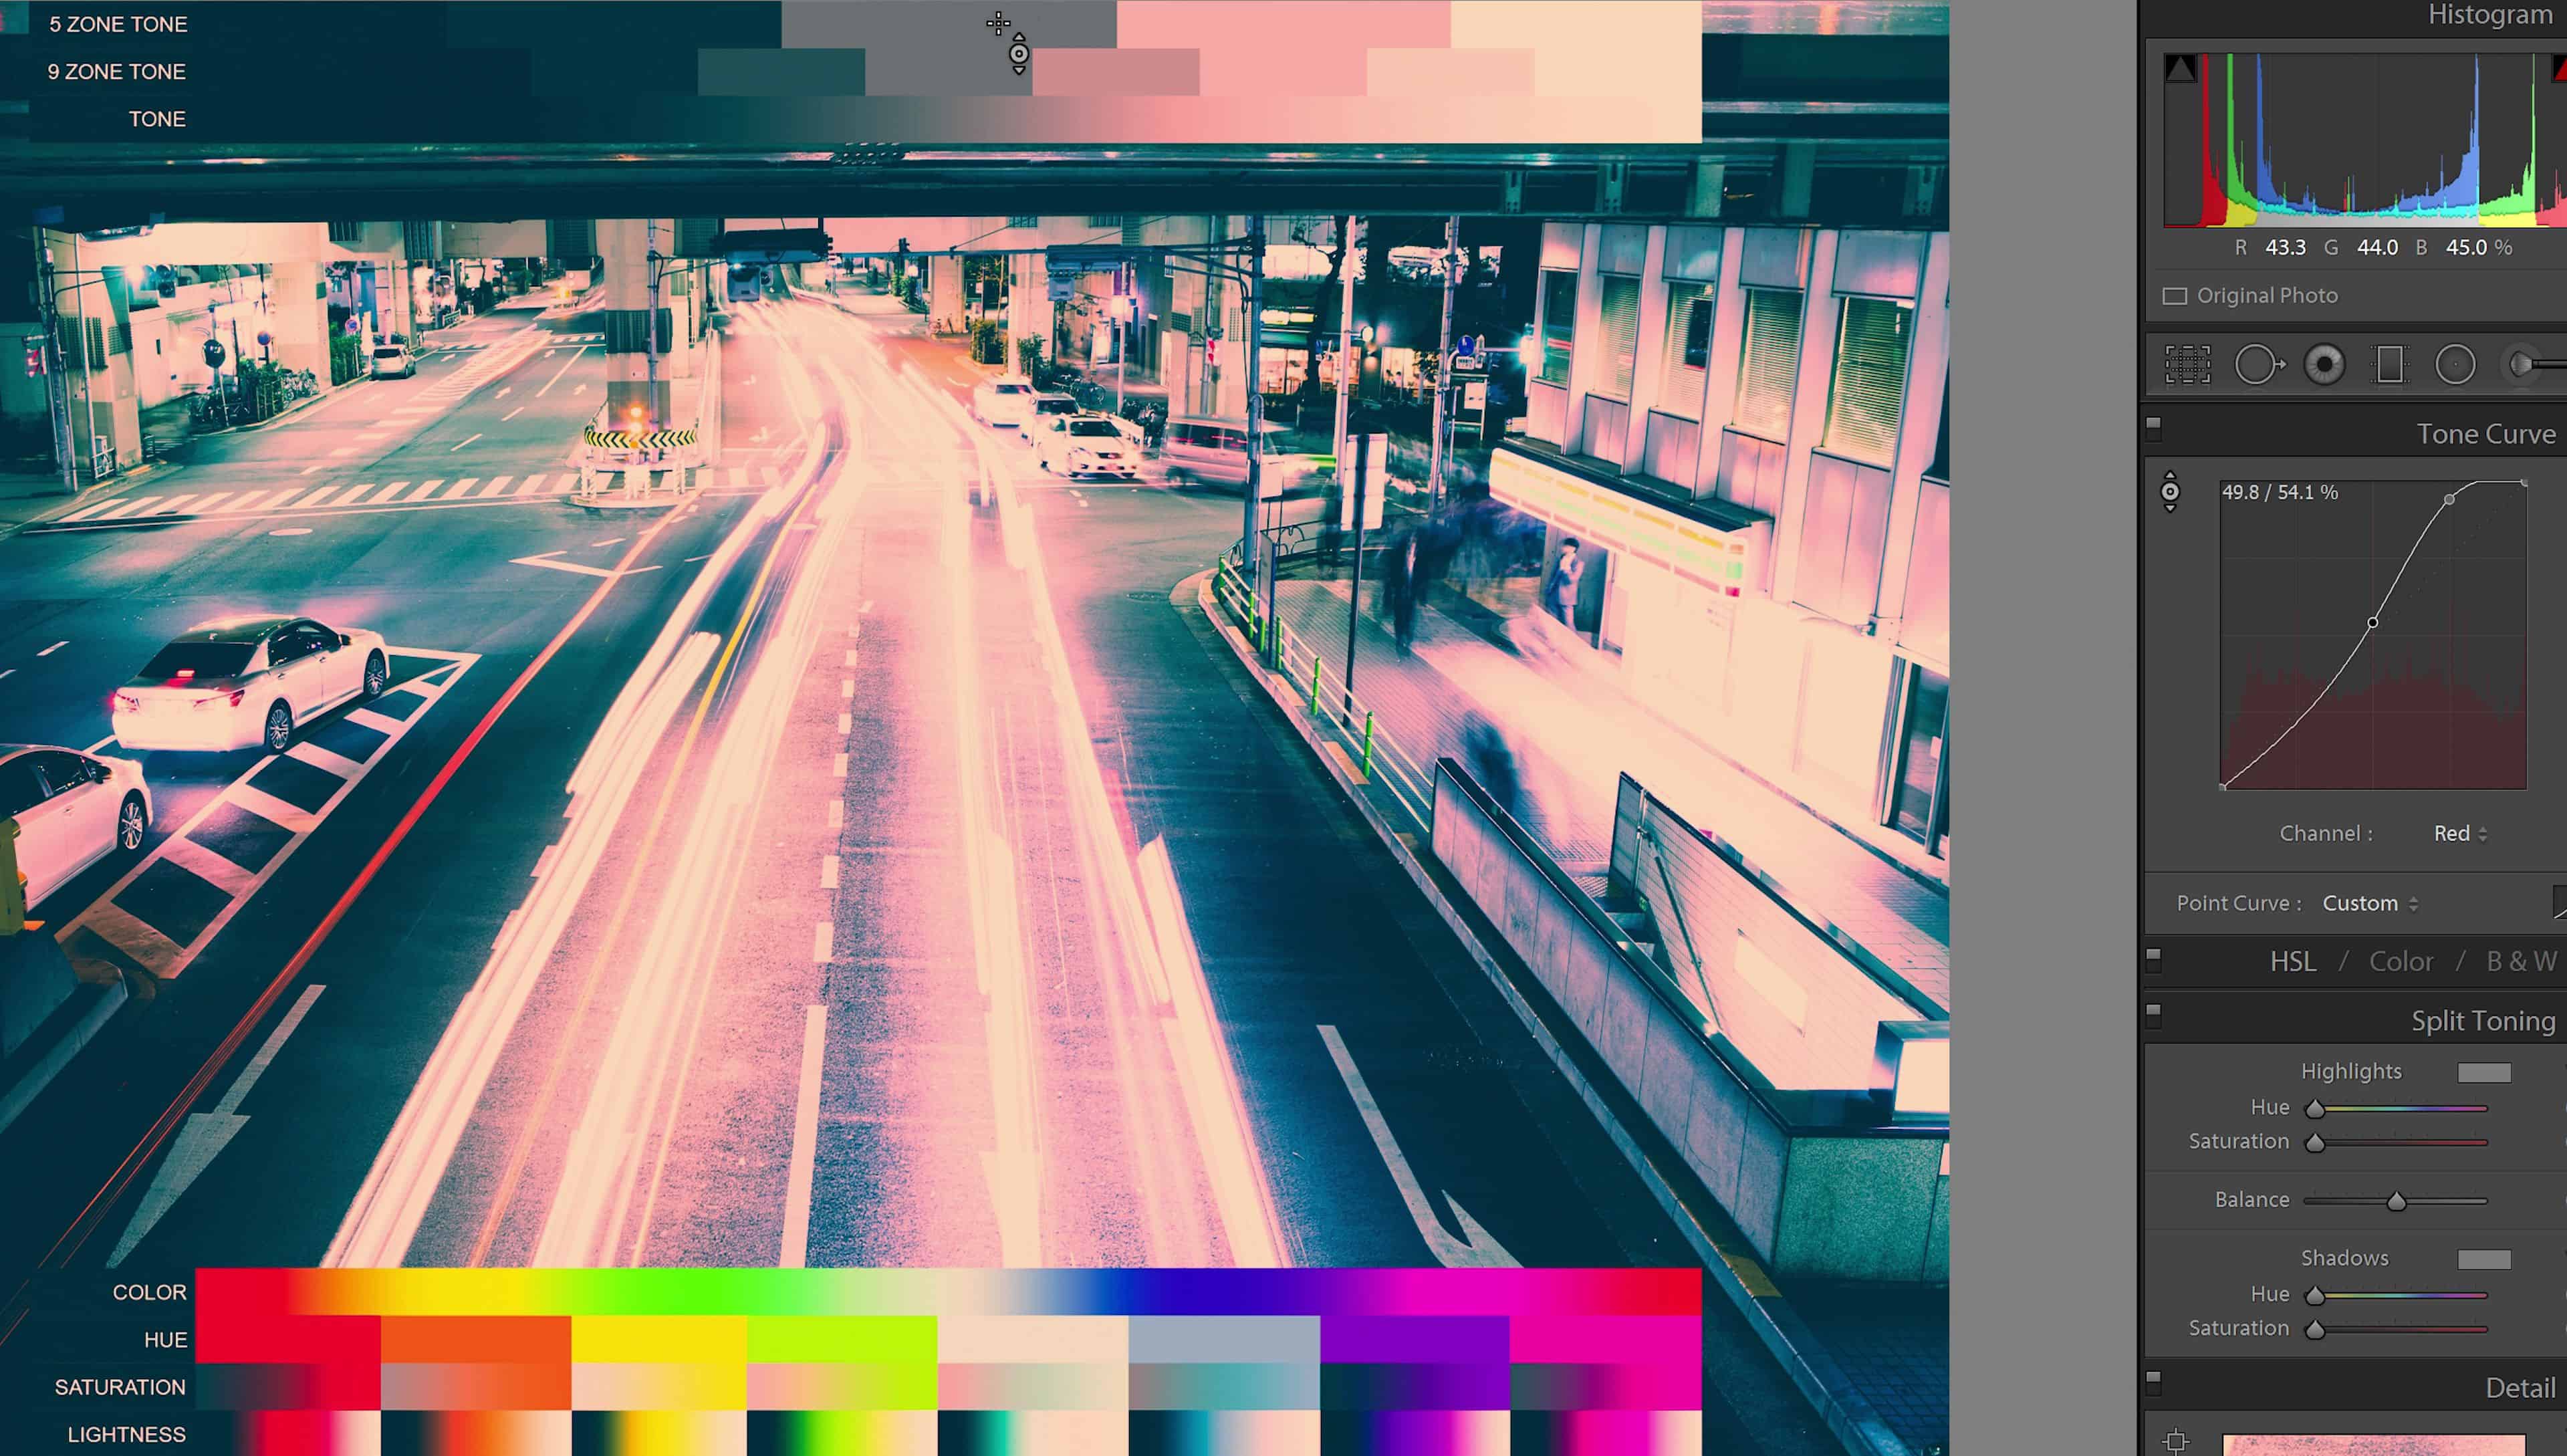
But it’s also affecting the other zones so I’m going to drop them back down in the highlights.

I want to be a little more precise so I’m going to move to the 9 zone tone chart and play around with the zones around here.
Step 13
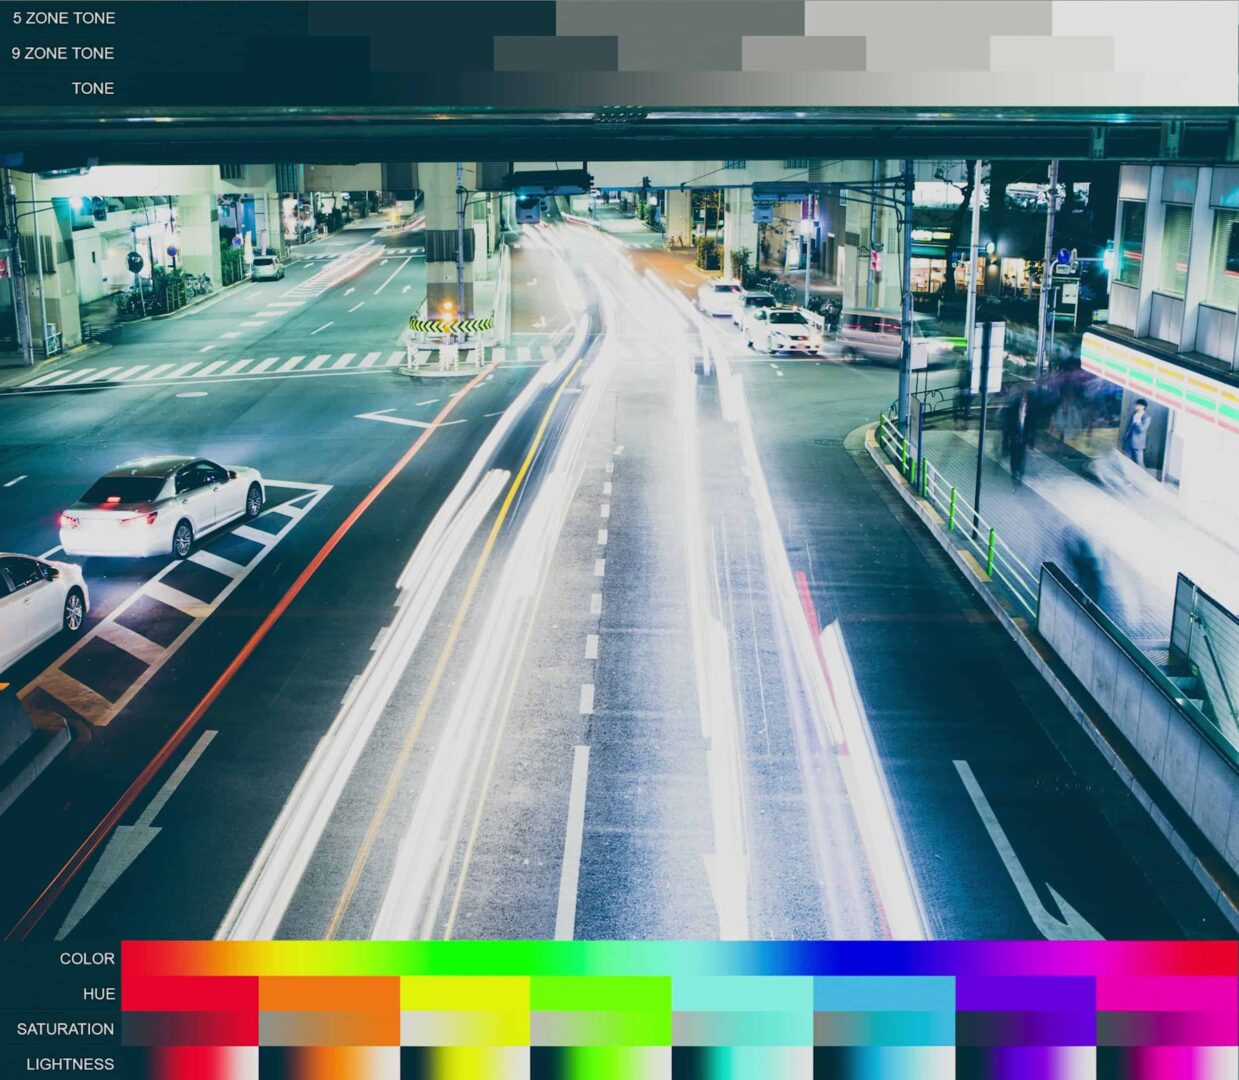
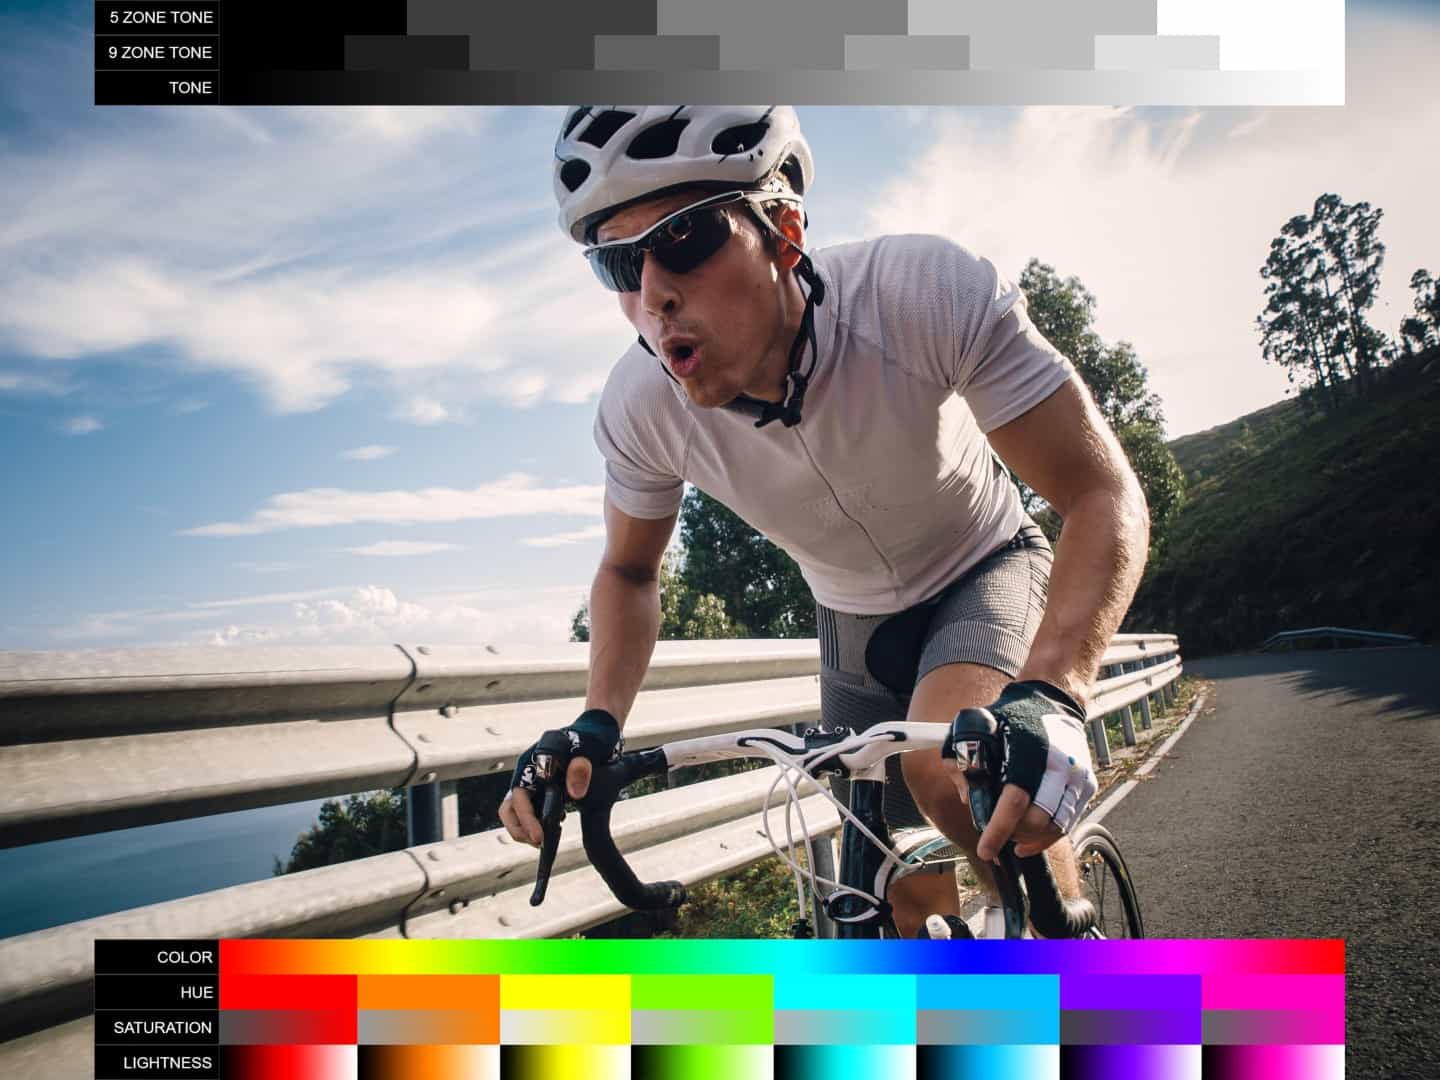
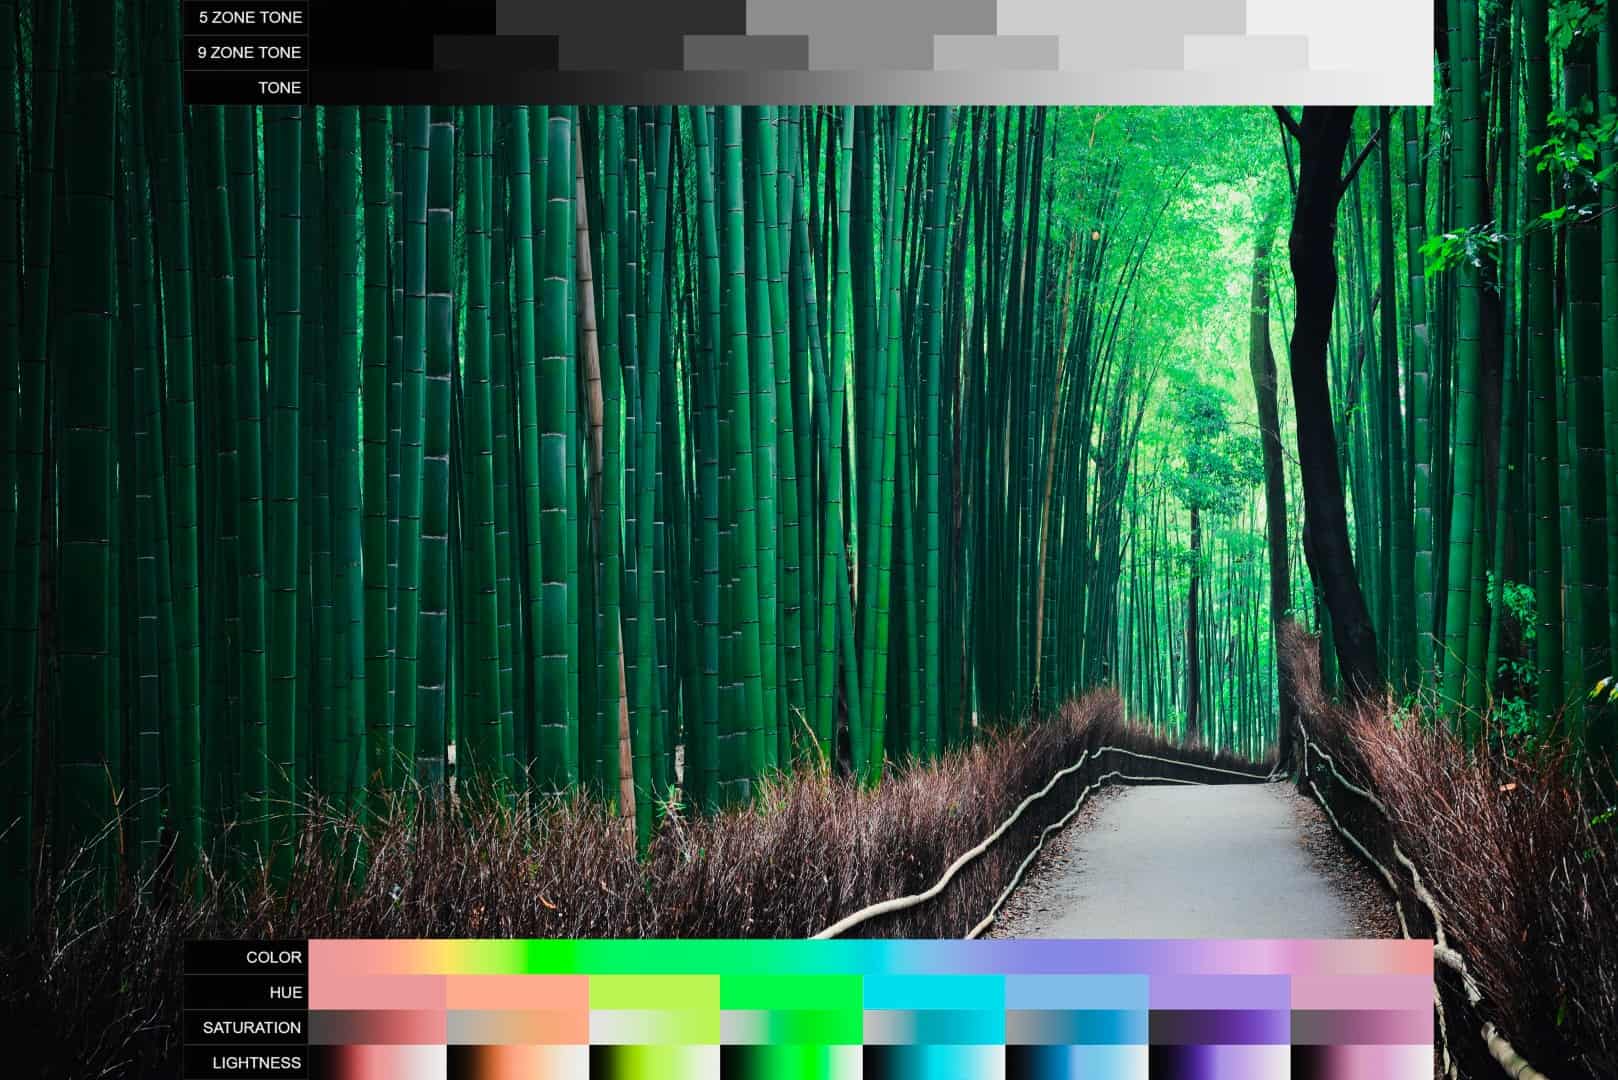
Remember earlier how I talked about the gradient chart and how it should be smooth and gradual? Well if I make a drastic change like to the tones, you can see that the gradient isn’t very smooth anymore. We’re going from red to green to red. That’s a pretty abrupt change and while at first glance it might not be that noticeable in this photo, if you were to use in other photos or video clips, you might start getting some color banding issues.
Essentially it’s like this. The smoother the gradient is, the safer it is to use in other photos. And if you’re using this technique to create Lightroom presets, you definitely want to ensure that the gradient is smooth.
The effect doesn’t look quite perfect so I’m just going to go into the channels and tweak the settings a bit. The best way to learn the tone curve is to really just experiment and get the gist or the feeling of how it works. You don’t need to know exactly which tone you should adjust or what shape your tone curve should be. Really, the most important thing is to get the instinctive feeling of how it works so that it feels second nature to you. And that’s really the best tip I can give to you- to keep experimenting until it feels second nature.
Step 14
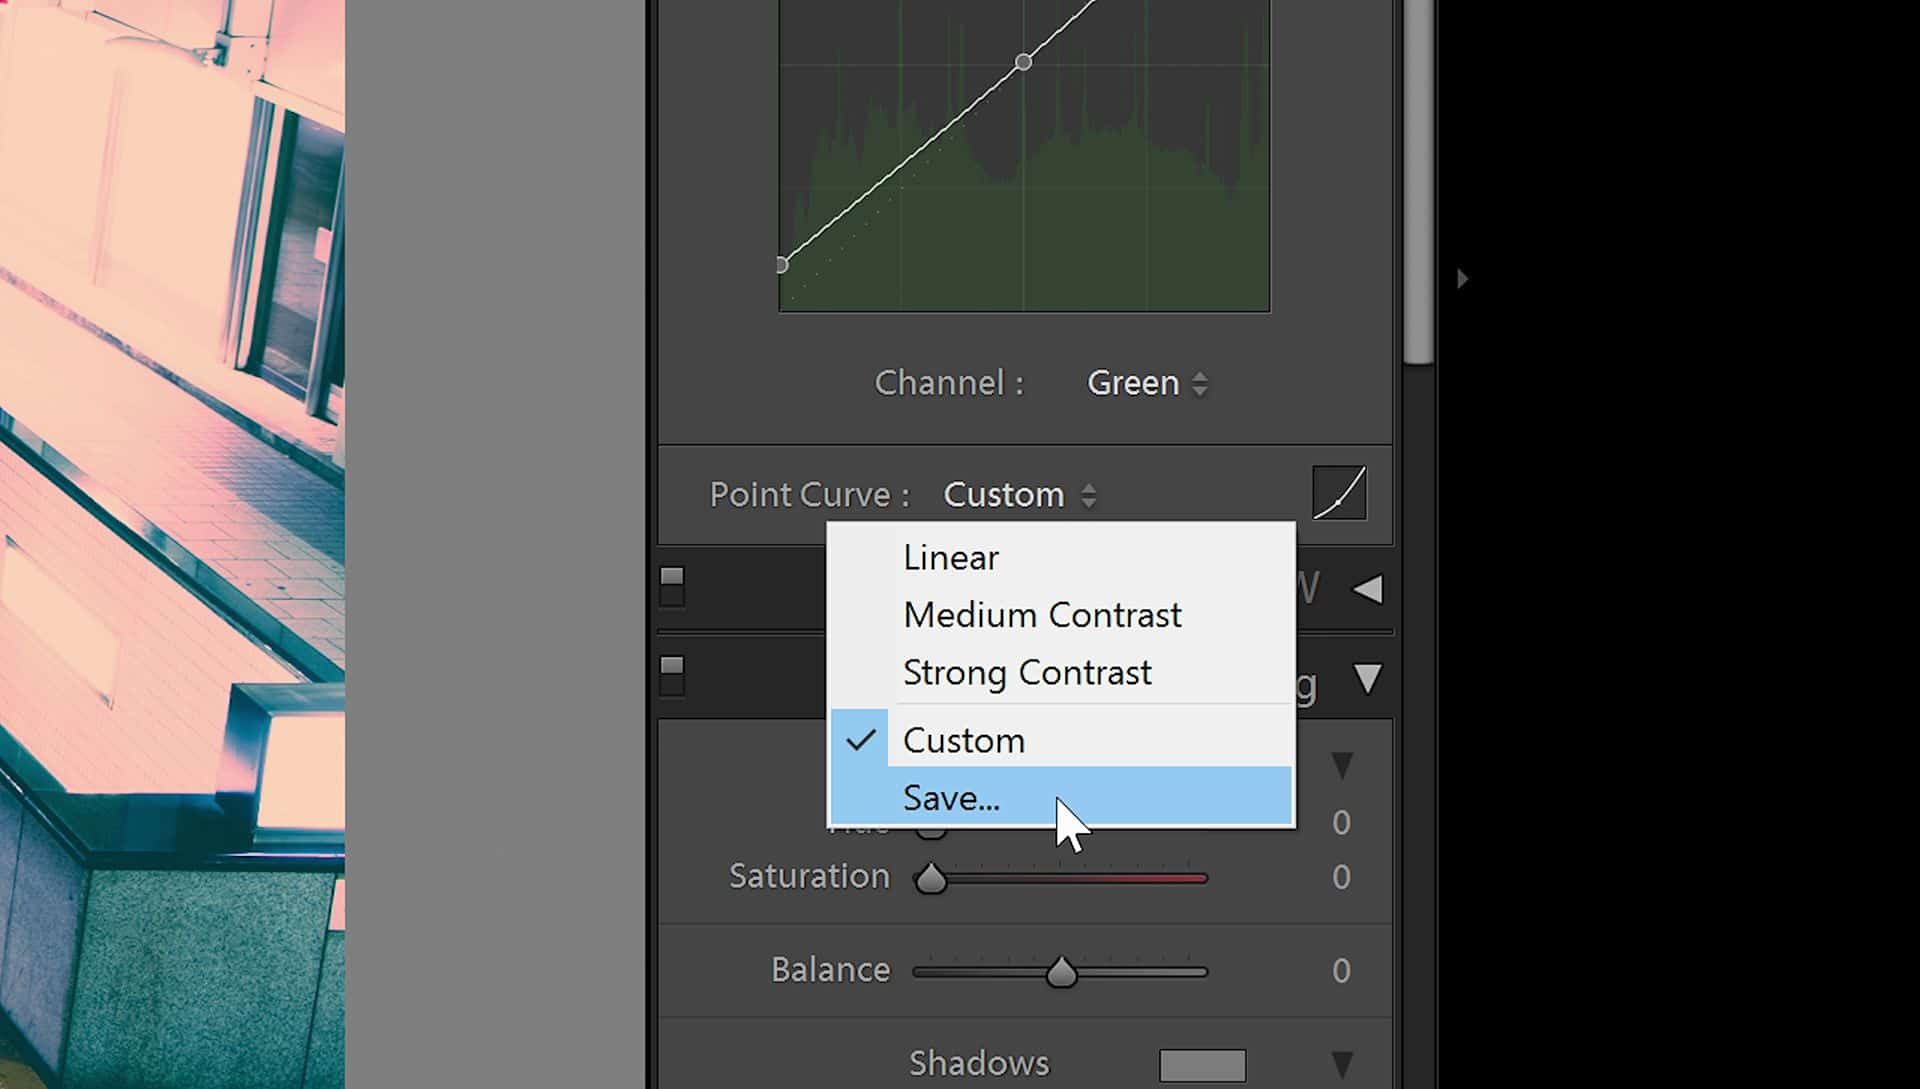
We’re done with the tone curve. If you want to save it, you can do it by clicking on this dropdown menu here and selecting Save. This will let you access the same tone curve any time from this dropdown menu.
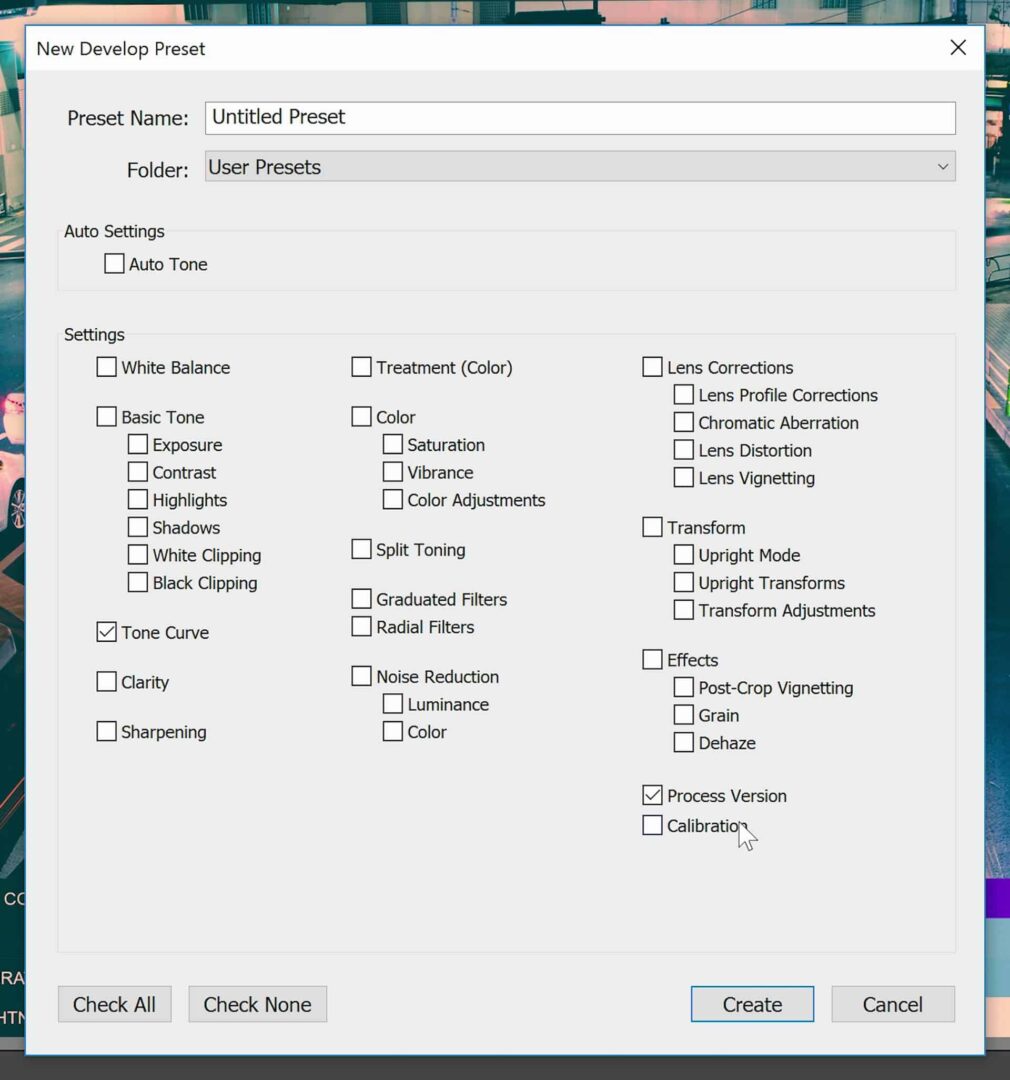
You can also save this as a Lightroom preset by pressing this plus-sign button here in the Presets panel.
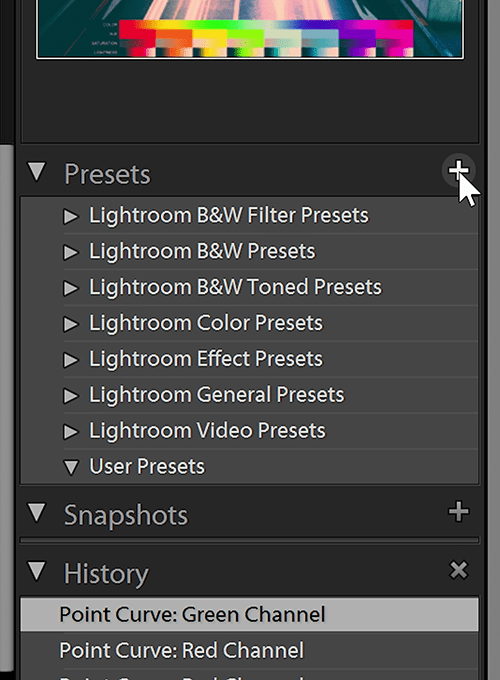
Make sure you deselect everything and only enable the Tone Curve and Process Version options. Give it a name, click the Create button, and now you got your own preset.
Step 15
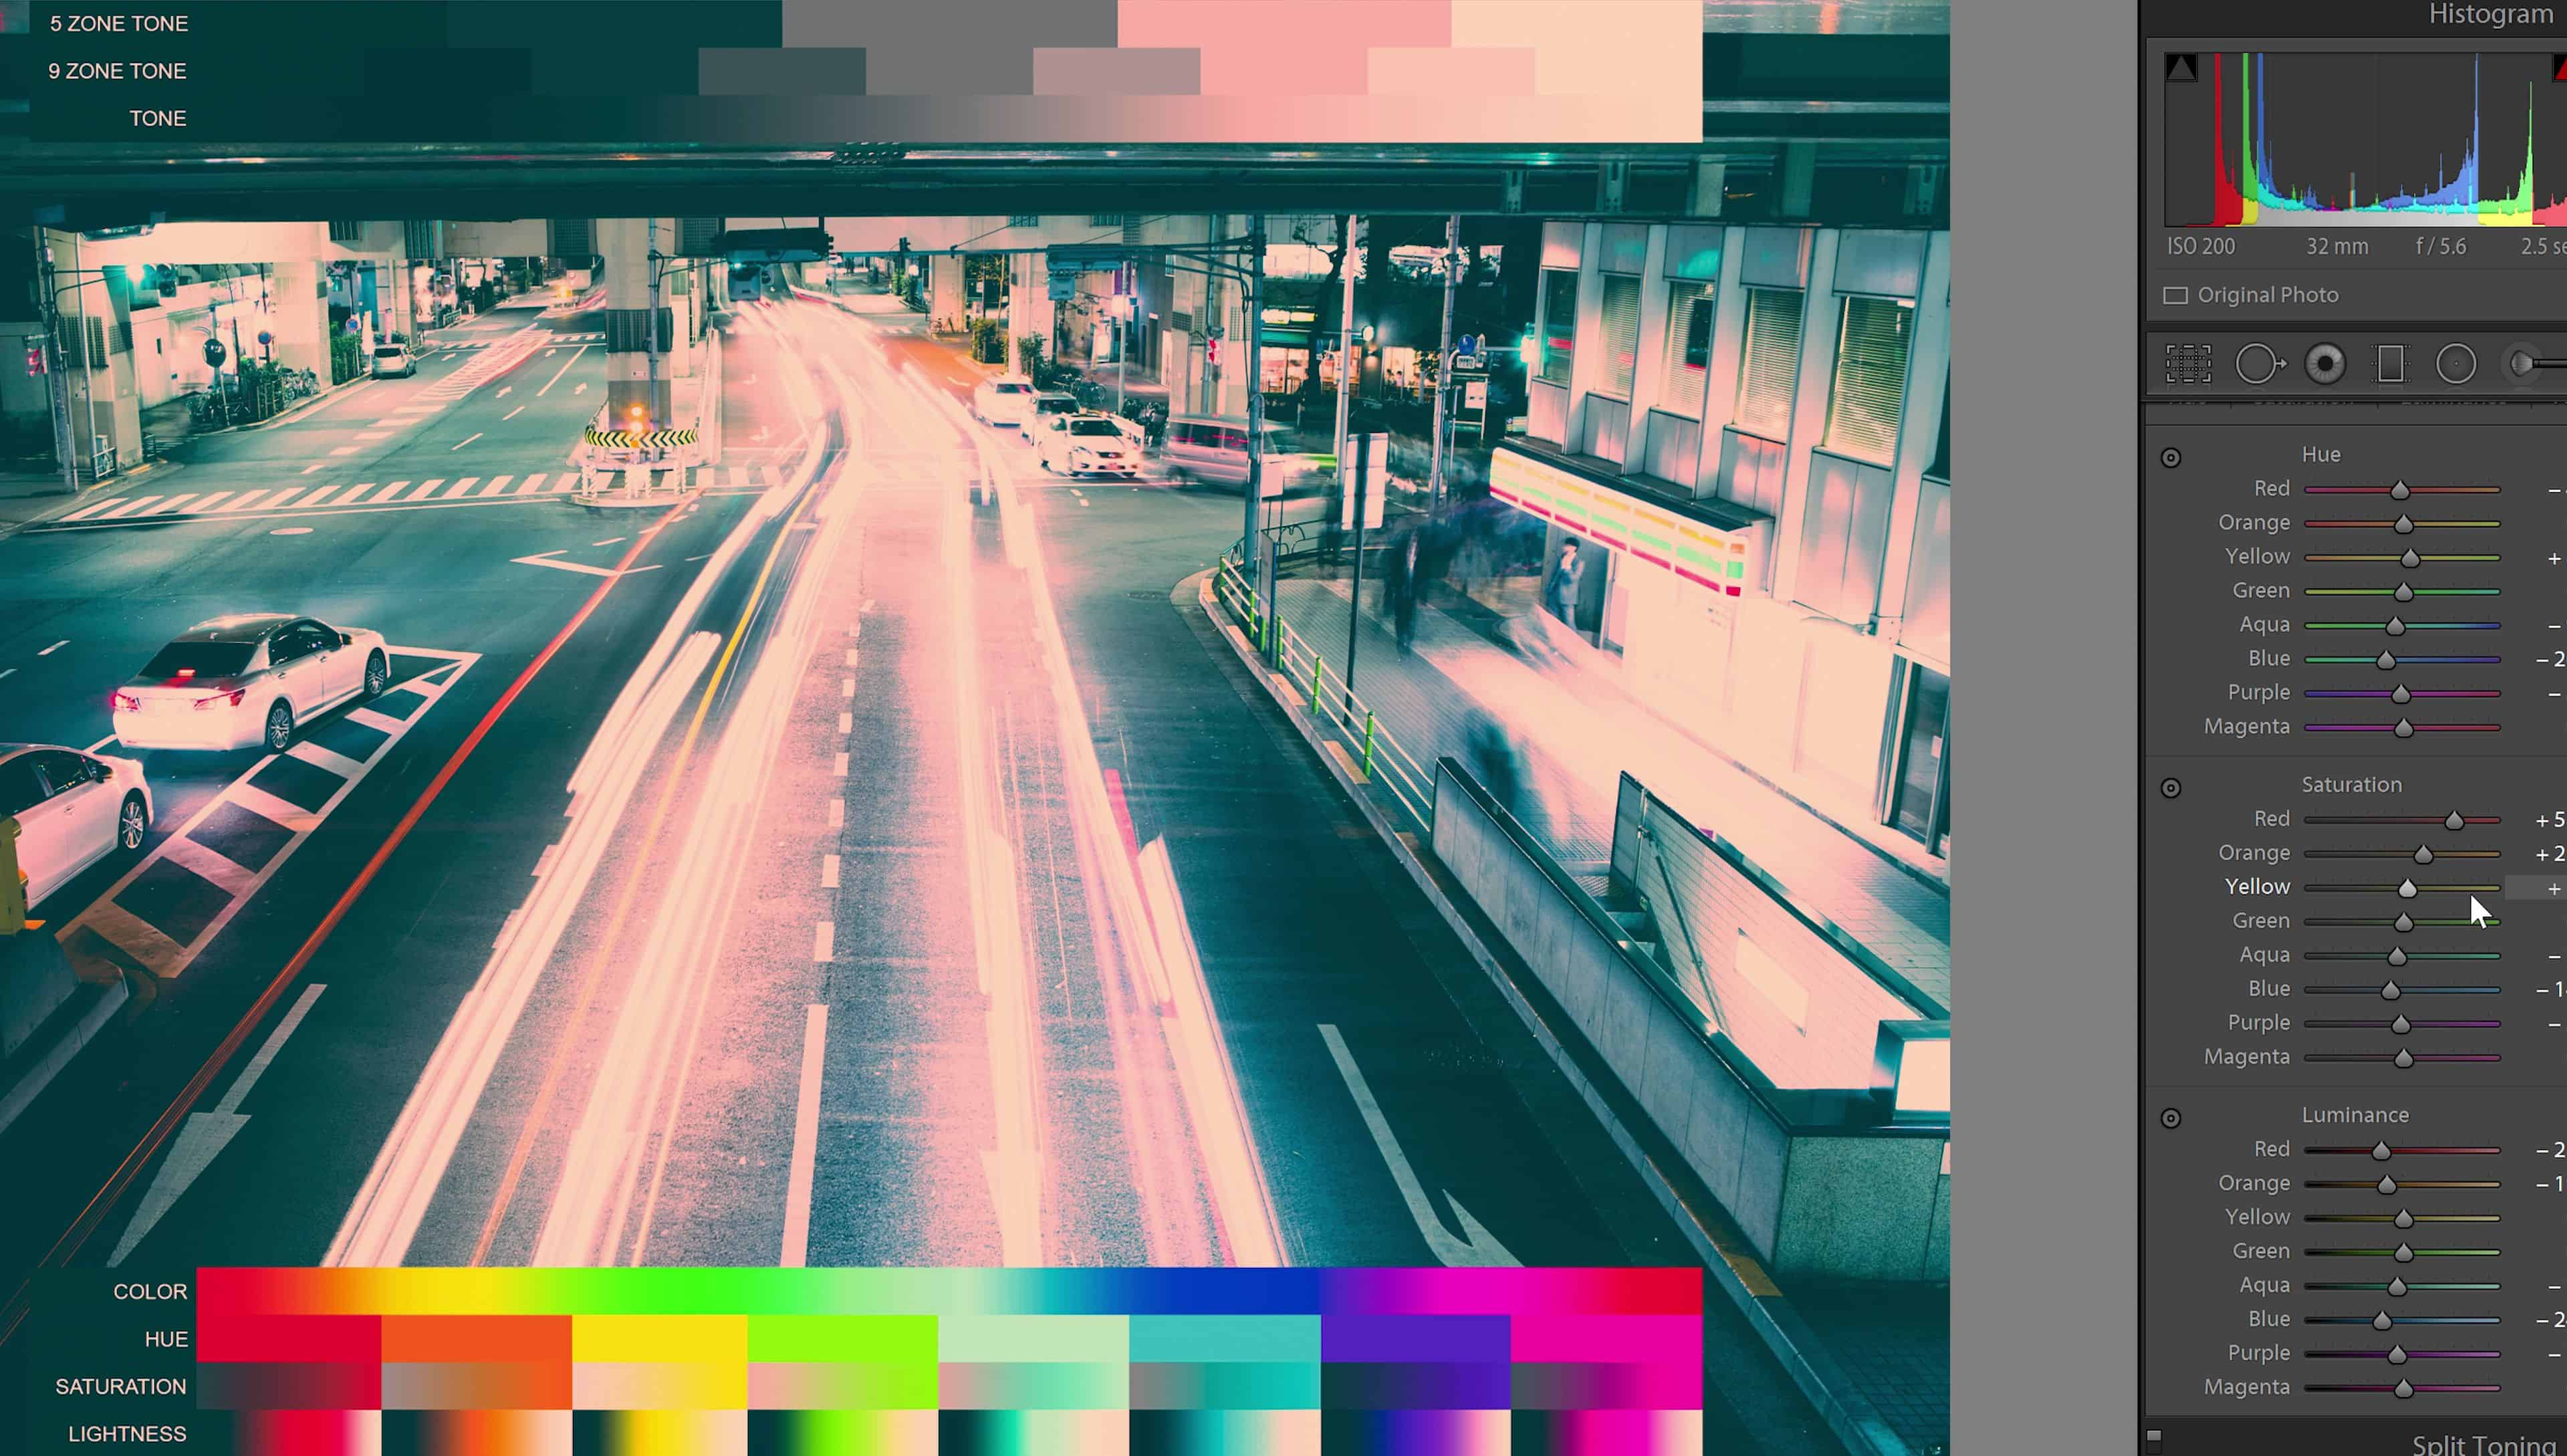
But we’re not done. What about this bottom color chart? Well the tone curve can create the bulk of your color effect. But there’s more you can do. Although some effects like the Instagram Nashville effect can be created with just the tone curves and nothing else, other effects like film looks get their look by altering the colors (hue, saturation, and lightness).
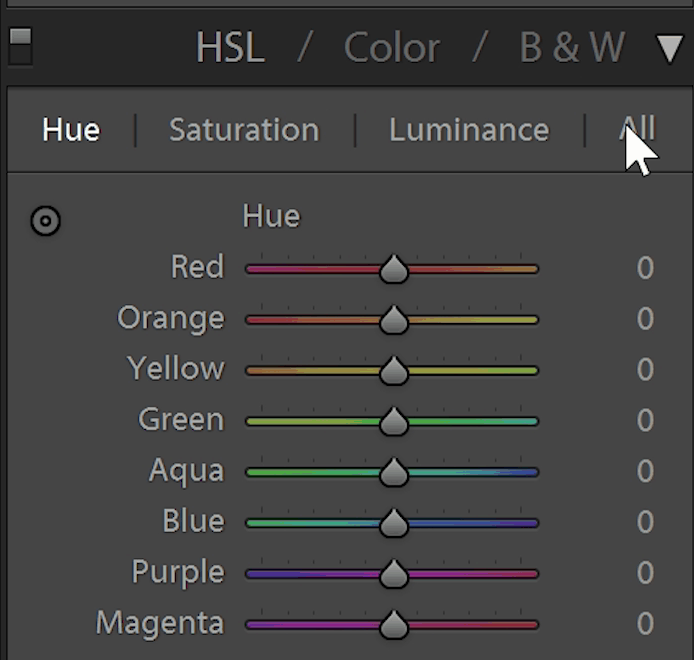
For this section here, we’re using the HSL adjustments. You can find this by opening the HSL panel and clicking on the All tab. Once you’re here, you can start playing around with the setting. I actually prefer using the sliders instead of this Targeted Selection Tool because when you use the tool, it tends to affect more than one color at a time. So for more control I prefer just using the slider.
Step 16
Here’s how to use the chart. There are four rows in this chart. The first is a gradient to ensure that your results are smooth.

The second is the hue so that you can see exactly what hue you’re getting.

Next is the Saturation and finally the last one is for luminance.
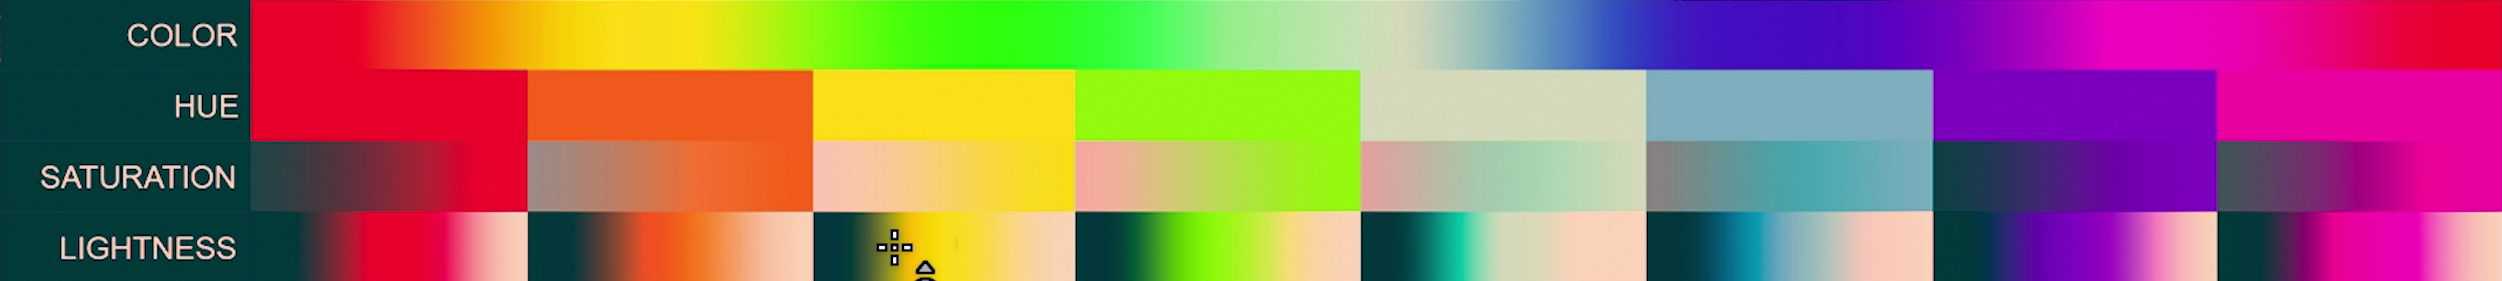
When you’re making adjustments to the hue, look at the hue chart. If you’re making changes to the saturation, look at the saturation chart. Same thing with the Luminance. This lets you visualize how you are affecting the color and it can sometimes act as a warning system in case you make any changes that are way too strong.
How you adjust the color is up to you. But I usually like to start with the hue, saturation, then lightness. Play around with the settings to get something that you like. Sometimes these color settings may not seem as drastic as the tone curve but these settings that give you the unique color characteristics you see in traditional film.
Step 17
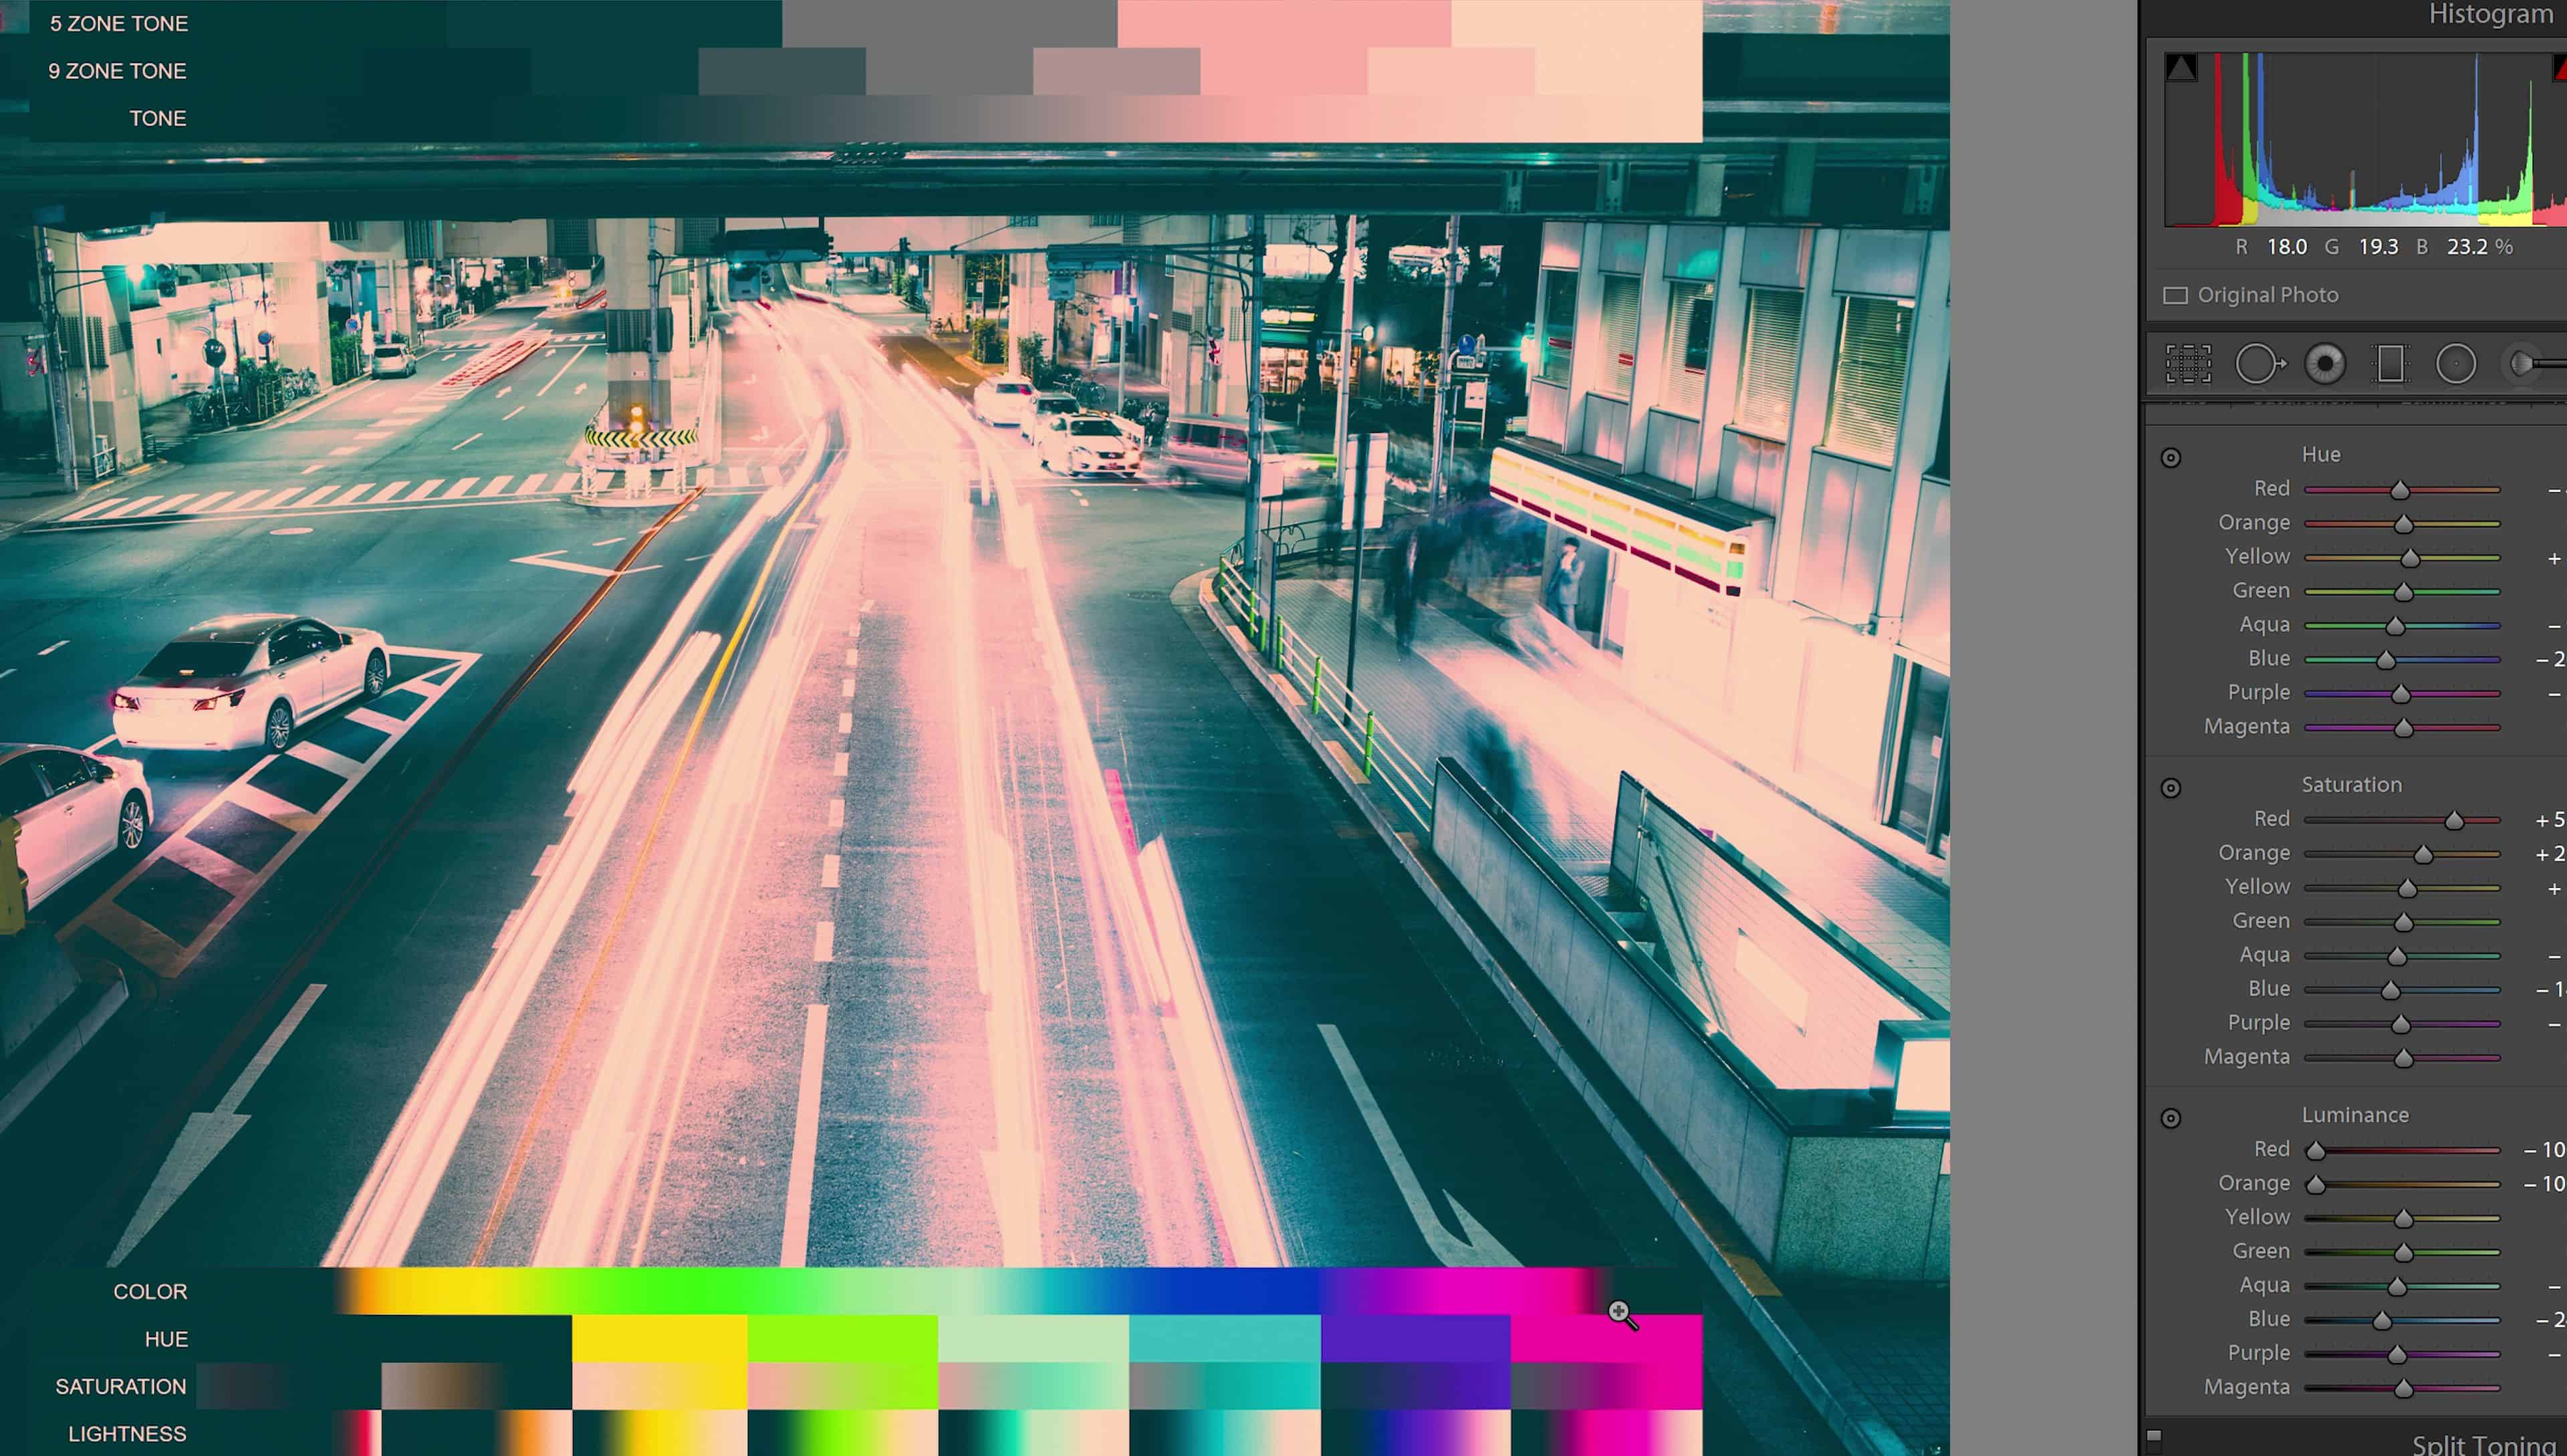
As your adjusting, make sure that you keep an eye on the color gradient. You want to ensure that this is smooth. You can see in the image below that the gradient isn’t smooth. It has a sharp change. When this happens, you need to go back and reduce some of your settings to make sure it’s a smooth gradual transition.
Remember, just like with the tone chart, hard edges in your gradient might work fine on the photo that you’re working on now, but it might not look so great in other photos. The smoother the gradient, the safer it is.
Step 18
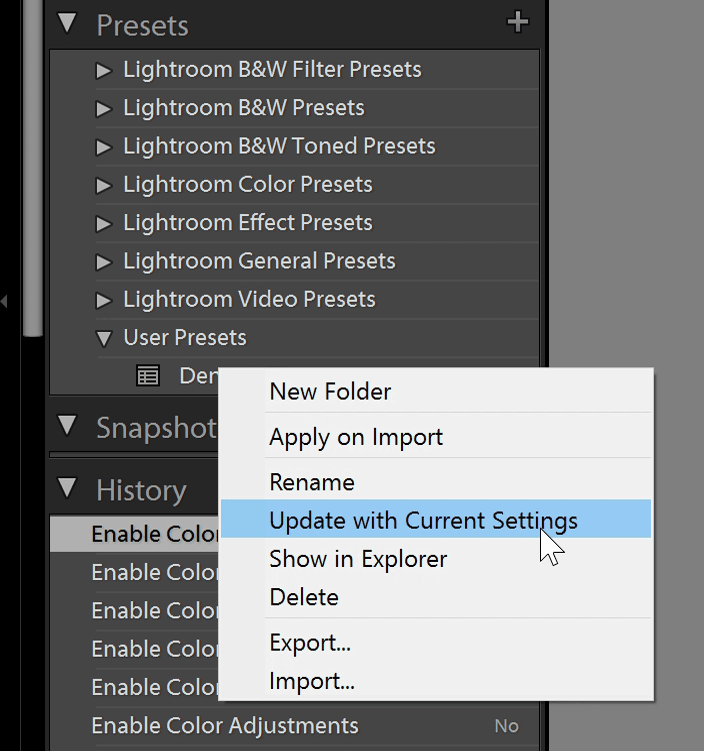
When you’re done, you can update your previous preset by right-clicking on it and selecting the update option. Or you can save this as a new preset by clicking on the plus sign in the presets panel.
Make sure that the only thing checked is the Tone Curve, Color adjustments, and Process Version.
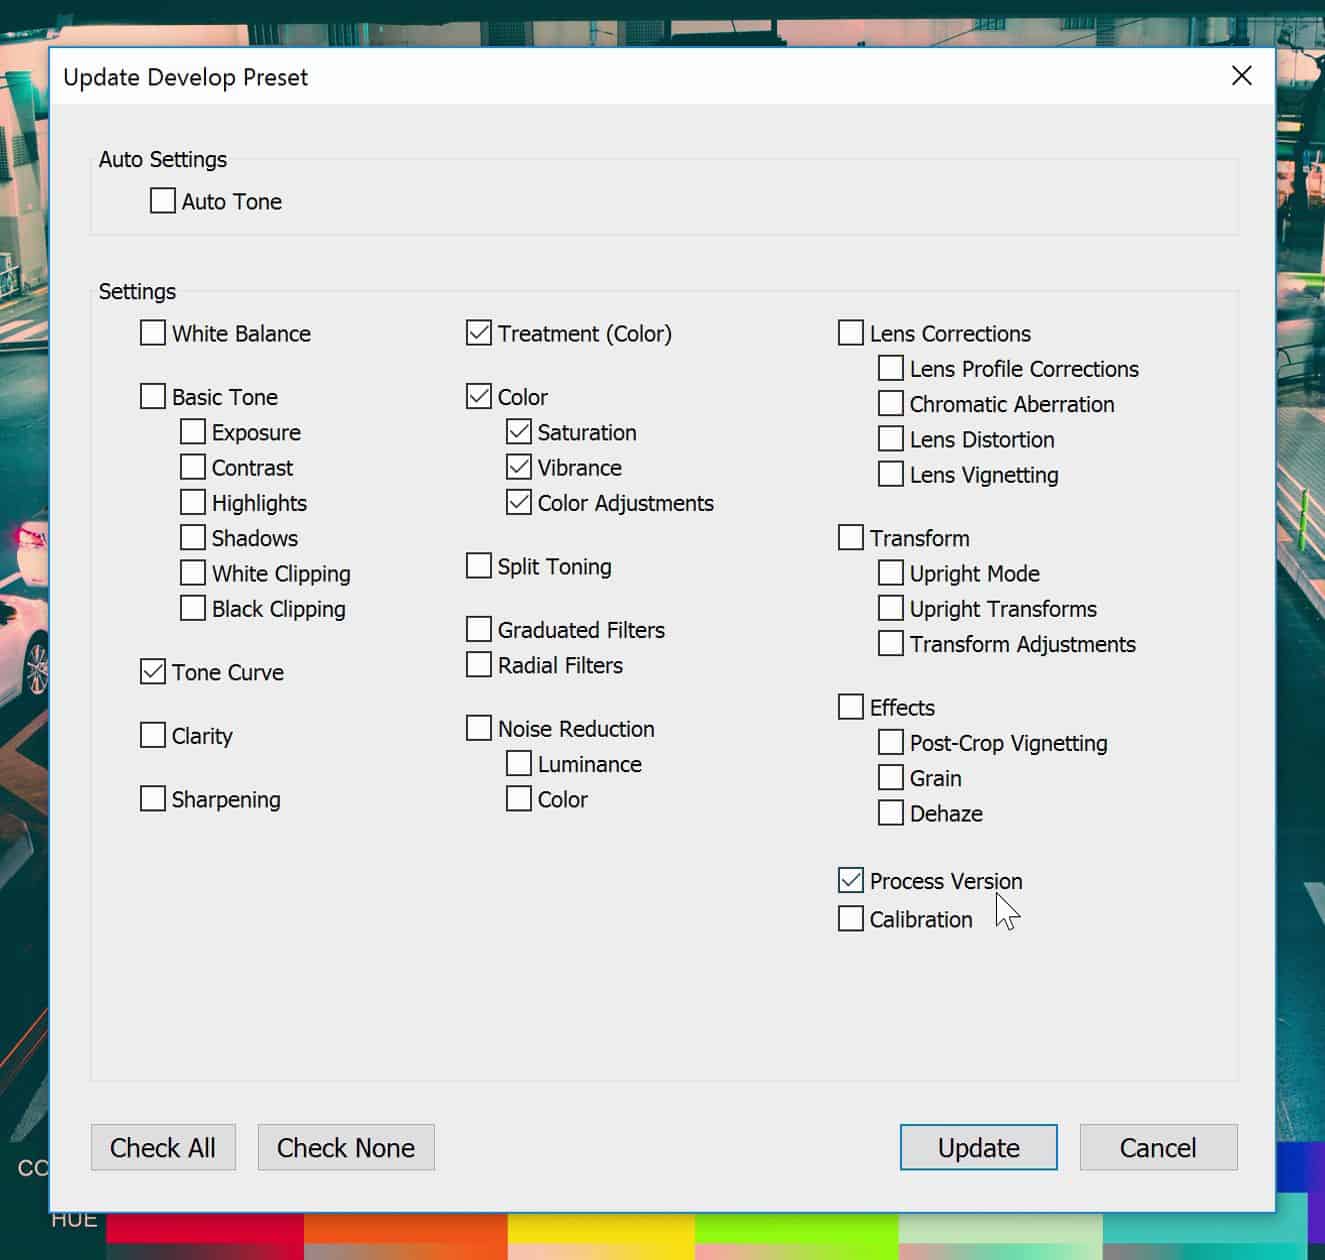
If you’re creating a preset pack with like 10 or so presets and some of those presets affect other settings like the Clarity, Vibrance, Vignetting, Noise, etc., make sure you checkmark those option so that your preset will overwrite the setting and reset it back to 0. This is so that if you apply a preset that lets say adds some grain, and in your new preset you don’t want the grain to appear, it’ll automatically reset it back to 0 or no grain. So that’s just a tip to make things more convenient if you’re ever thinking of creating presets for others.
Benefits of This Technique
1. Minimal and Lightweight Presets
We’re done using the tone chart but I want to point out two things we did that are really cool. First let’s look at the basic develop settings here. The settings here are all untouched. The White Balance, Exposure, Contrast, etc… everything here is untouched.
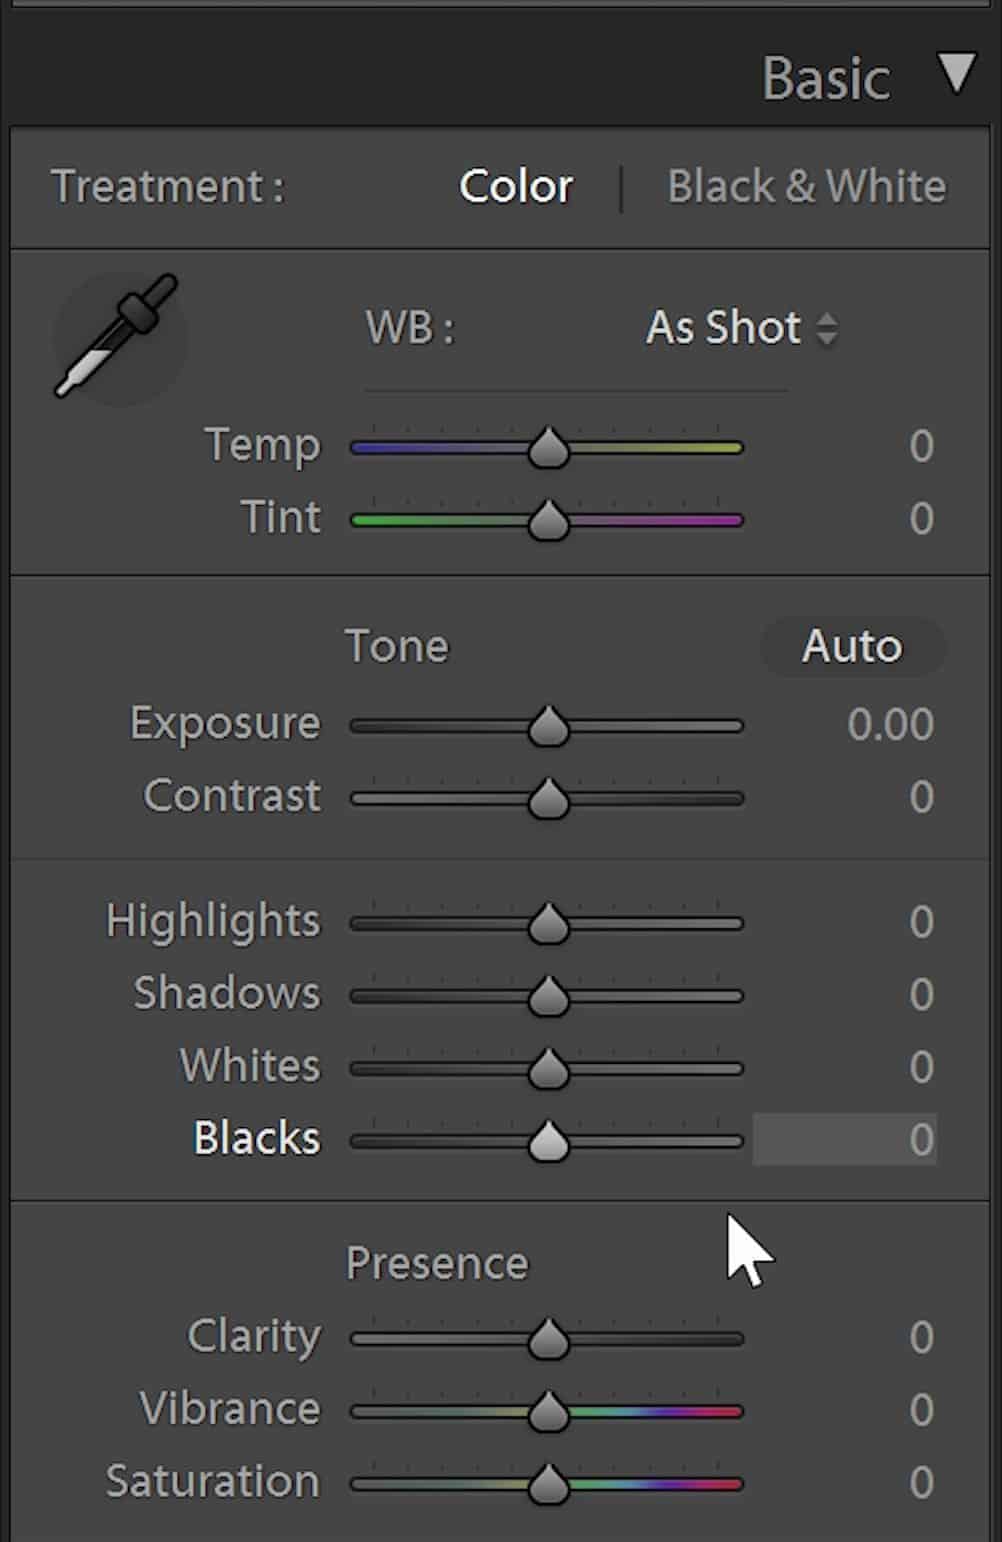
And that’s really amazing because it means that your preset won’t make you re-retouch your photo. What I mean by that is that most people start by fixing their photos. They correct the white balance, exposure, and other settings. But if you’ve done this (and lets pretend we shot a wedding with 500 photos and fixed the white balance and exposure of all 500 photos), the last thing we want is to apply a preset that overwrites our settings forcing us to fix the white balance and exposure all over again. That’s a huge waste of time. So by creating minimal presets like this (just the tone curve and HSL), not only is it faster to render, it’s also saves you a lot of time.
2. Works Great for Videos
The final thing I want to mention is that if you have any video clips, you can go to the Library mode and apply a saved preset. This is great when you want to color grade your videos but you don’t have the full Adobe Creative Cloud plan. Your video will render fast because you used the absolute minimum needed to create the effect. And if your preset has no HSL adjustments and only the tone curves, it’s going to be incredibly fast.
The tone curve is GPU-accelerated in Lightroom but it doesn’t even matter because it uses so little processing power that even a really slow computer will render it quickly.
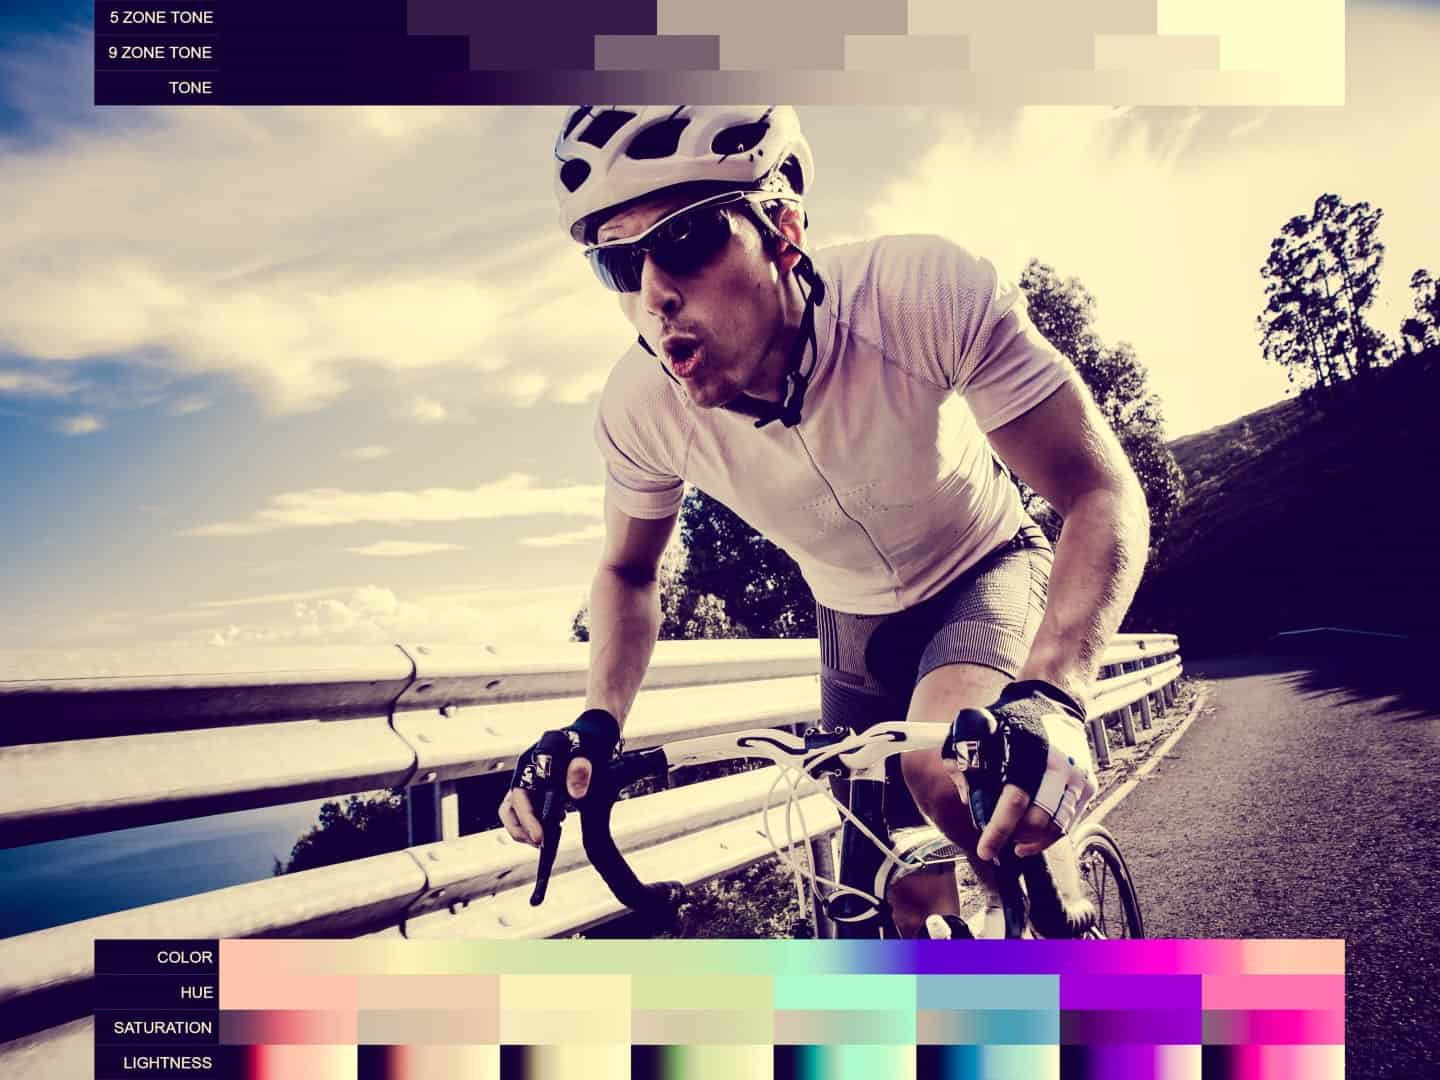
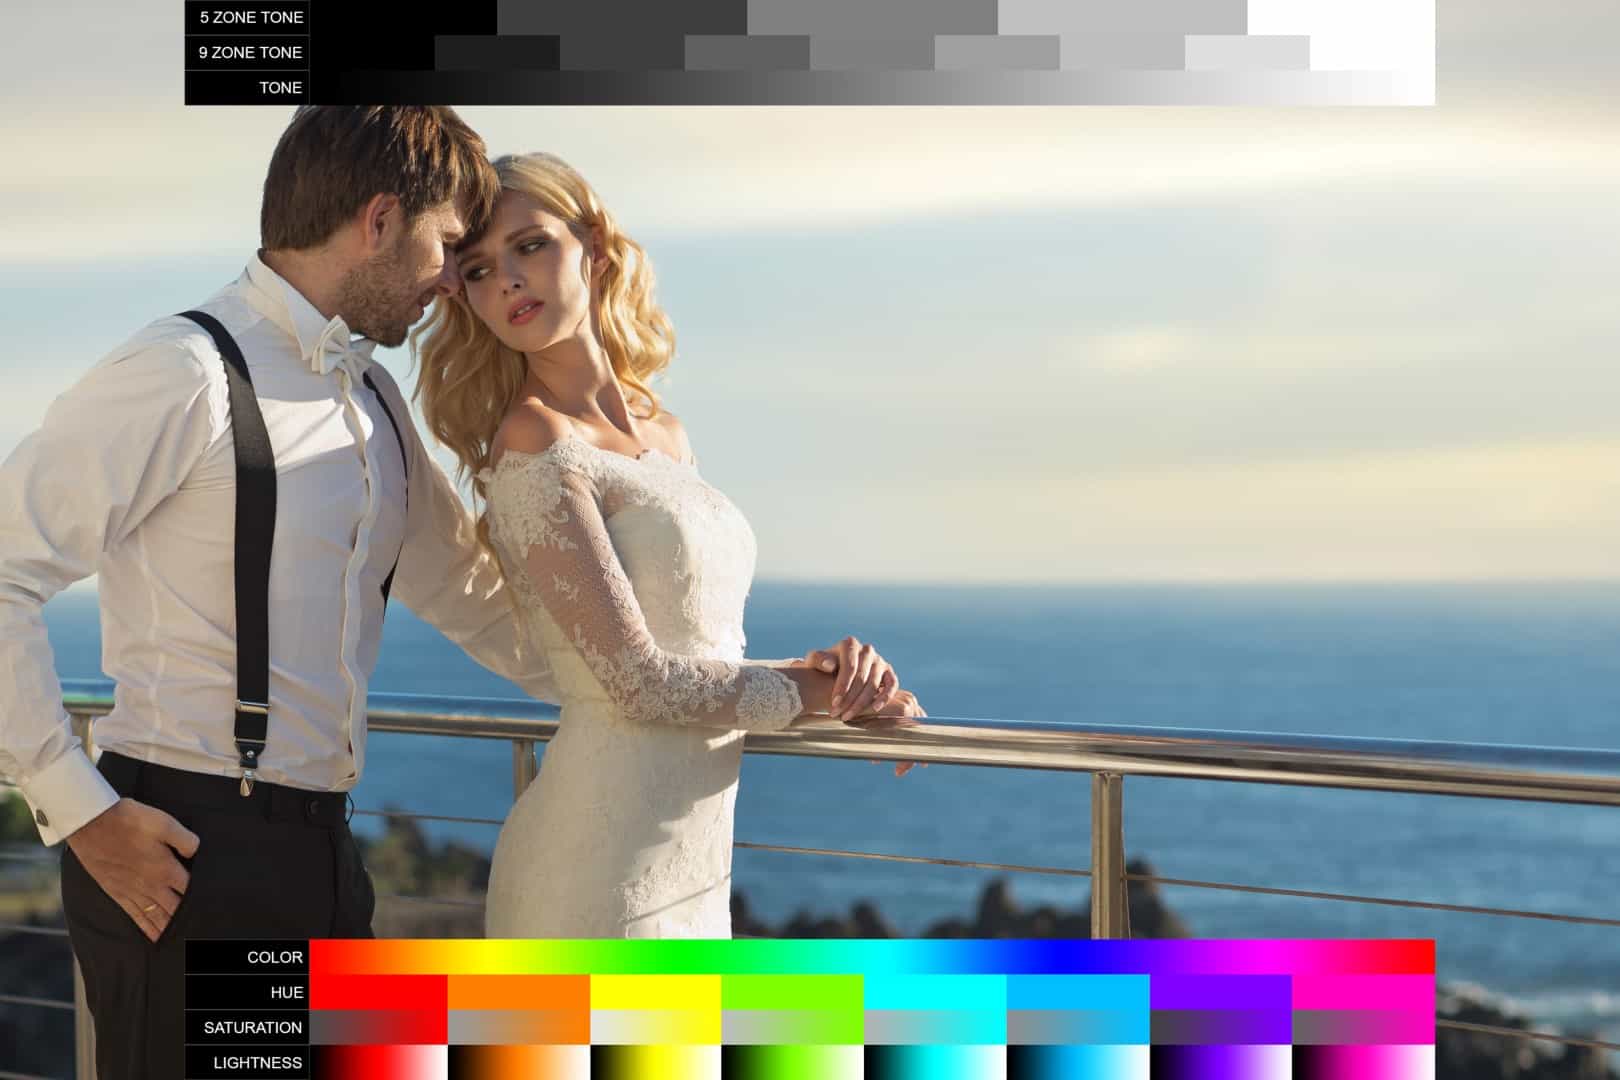
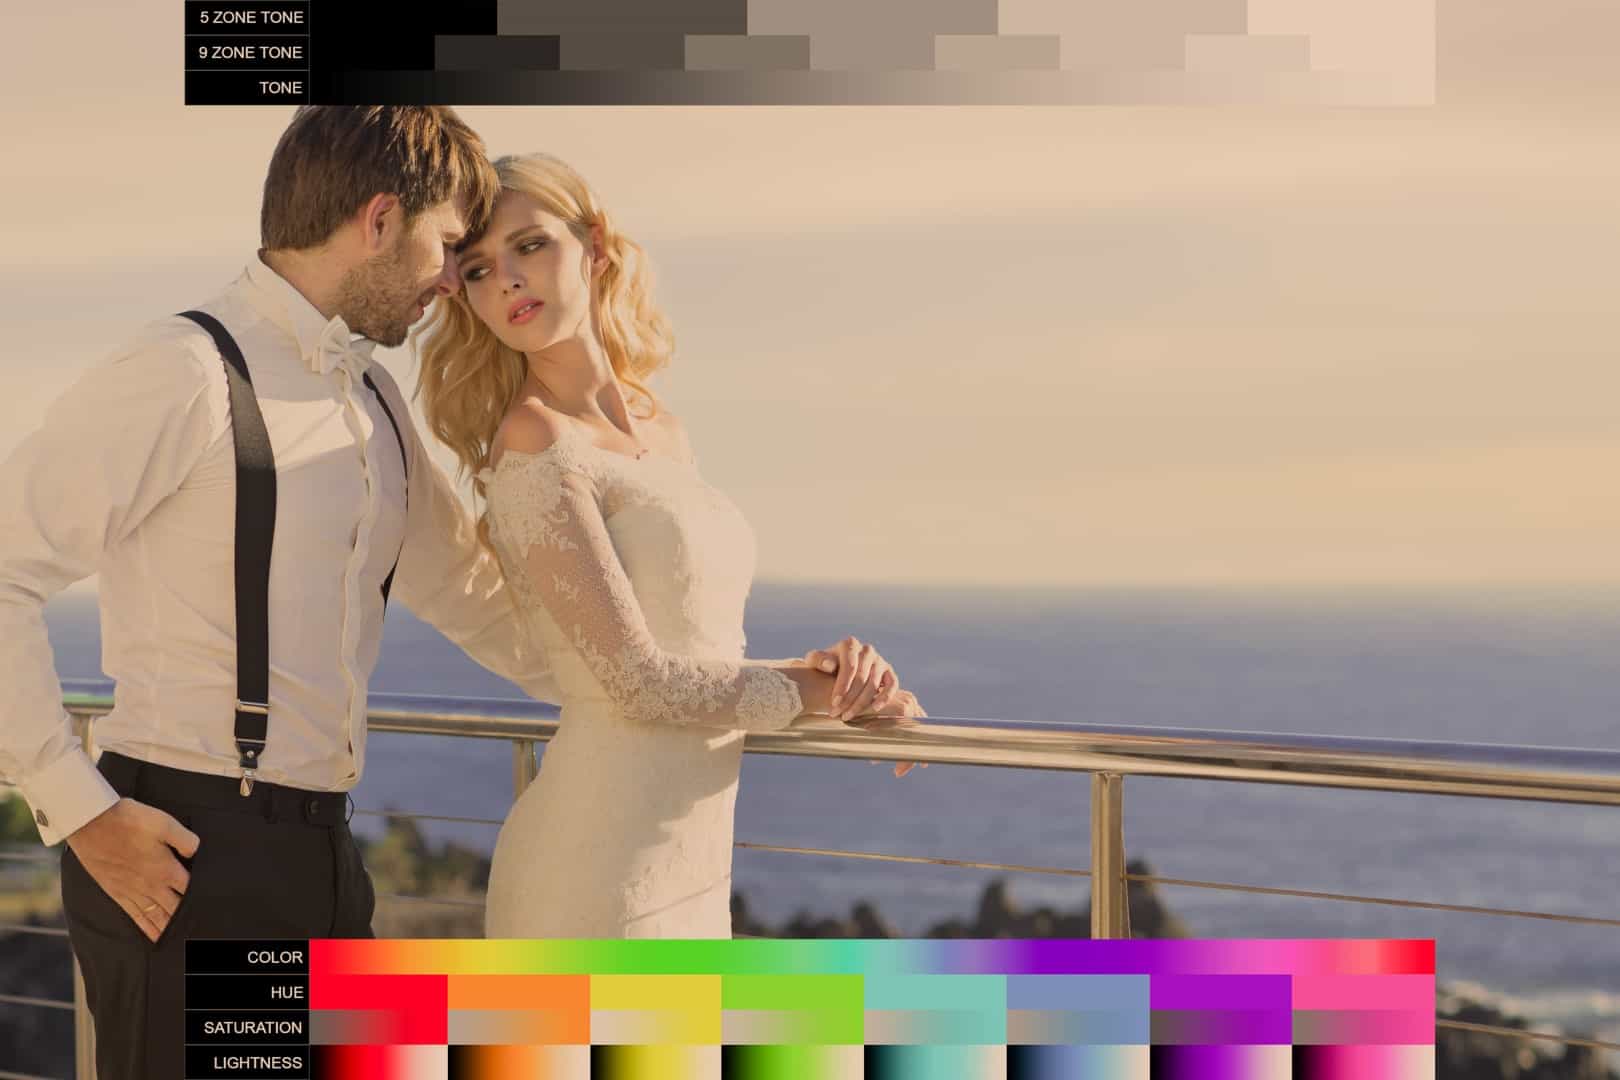
Examples
Here are some examples of effects I created using this same technique.
Wow, this is the closest tutorial I’ve seen to replicating Masashi Wakui’s work. Thank you so much and very well done!
Thanks Toby!
Dan = I still do not understand if you need Photoshop to make this chart work.Where is the chart residing ?
You can use any image editing software to place the tone chart. All you need to do is place the chart over your image which unfortunately can’t be done in Lightroom.